
Assessment

Chocolate Mania [3 Act Task]
This post and task was written and created by both Jon Orr and Kyle Pearce.
For about a year now Kyle Pearce and I have been travelling to schools and districts across North America sharing our techniques on how to Make Math Moments That Matter for our students.
In those live workshops we’ve been using a task without a name. On the first anniversary after creating that task we wanted to share it here with you and give it a name.
We’re all about creating tasks and then thinking about how they might be modified for use across a variety of grade levels. With a few modifications, you can successfully run this task in classrooms from K through 10. In particular, you could address the following expectations:
- building estimation skills;
- building multiplicative thinking and proportional reasoning using arrays;
- building multiplicative thinking and proportional reasoning using double number lines;
- making connections to the inverse relationship between multiplication and division;
- connecting double number lines and ratio tables to creating and solving proportions through algebraic reasoning;
- highlighting the value of the constant of proportionality (i.e.: unit rates) so students can “own” every problem possible in a proportional relationship;
- determining rates of change;
- representing linear relations in various ways;
- solving problems using the four representations of linear relations; and,
- many more.
Here is Chocolate Mania:
Act 1: Sparking Curiosity
Ask students to create a notice/wonder table or you can use one that we built for our online workshop Making Math Moments That Matter.

Ask your students to write down anything they notice and anything they wonder while viewing this video:
Note: There is no audio. Can’t see the video because you’re viewing this post in a rss reader? Click here to go to the post page.
Here are possible notice and wonders from our workshop participants and also some from our students:
- They’re both wearing plaid.
- The video is in reverse.
- How many chocolates will they eat?
- Did they get sick?
- How long did it take to eat all the chocolate?
- It looks like they’re spitting it out.
- Kyle is eating Kisses.


At this point the students’ responses are listed on the board during the class discussion.

After capturing all the notice and wonders on the board steer the class to working on the problem:
“How many chocolate did Kyle eat? How many did Jon eat?”

Have your students estimate how many each of us ate. What is too high? What is too low? Your students may be feeling uneasy about their estimates; that’s okay! The point here is we don’t have enough information. To help with estimates at this stage we disclose that all the wrappers of all the chocolates we ate are showing in the image above.
We encourage you to record many of the estimates in a chart as a class. This will put some pressure on making those estimates carefully.

Act 2: Revealing Information to Fuel Sense-Making
To avoid rushing to the algorithm we’ll push down the curiosity path some more. Instead of just handing over all the necessary information to solve a problem ask the students what they want to know more about. This process is key; student anticipation of what is needed is a gold mine for understanding where they are in their thinking. By having them ask for information they have to start problem solving!
Students may ask for the time it takes for the whole video and you as the teacher can then say, “And what would you do with that if I gave it to you?” Listen to how they answer this. You’ll gain valuable information about where that student is on this problem solving journey. You will know after that answer if the student is thinking proportionally or not.
Here is some information to share:

Ask students to share what this series of photos tells them. What do they notice? What do they wonder? Then share this photo. It reveals the total amount of ml each of us consumed.

At this point students will have enough information to determine how many pieces of chocolate each of us ate. Let them go at it!
Fuel Sense-Making to Consolidate Learning.
Note: You or your students may want to work with more familiar numbers compared to what you see above. For example, to get a close prediction to the actual number of chocolates each of us ate a student may round the 111.8 ml to 110 ml and similarly round the 17 ml for 3 chocolates to 20 ml.
Depending on the grade level or skill level of your students we can expect to see some of these strategies
- Counting with familiar numbers;
- Using arrays;
- Number line counting;
- Tables of value counting;
- Long division;
- Unit rates;
- Solving Proportions;
- Creating and solving equations.
Here are some of those strategies:
Counting Up Chocolates and ml.
Students may count up 17 ml every 3 pumpkins until they reach close to the total amount of ml. If they go over the total amount they may want to subtract a cup of chocolates so they can get more accurate.

Here’s that strategy in action

Working with Fractions:
To get more precise answers we can encourage students to work with parts of chocolates in decimals or fractions. Many teachers would be inclined to stay away from fractions because they feel it may “de-rail” the lesson. We say use this context to reinforce fraction work and understanding.

Counting/Multiplying/Dividing Using Arrays:
Students may organize their counting strategy in a double array model. Simultaneously counting in groups of 3 pumpkins and 17 ml will allow them to see that they will need just over 6 cups of pumpkins, while showing the proportional relationship between the pumpkins and volume.

Double Number Line:
Students who solve the problem with a proportion will benefit from seeing it laid out on a double number line. By showing how to solve a proportion on a double number line we take a familiar concept (counting on the number line) and extend it to work multiplicatively. Students who solved the problem with an additive strategy will see the benefit of greater precision of using a scale factor.

Unit Rates:
Many students may use a unit rate to help solve this problem.

Note: This student will benefit from a conversation on notation, units and order of division.
Linear Relations:
You may choose to use this problem to either introduce or practice linear relations. I used this task to link the idea of finding the unit rate to determining the rate of change (slope) in a linear relation and then use it to build an equation to help solve the problem.

Reveal the Answer:
After consolidating the learning goals you wanted to bring out into the open for discussion with your class show them this reveal video of the actual number of chocolates each of us ate. Be sure to go back and validate those students who estimated the closest early in this task.
Is there a Volume relationship?
We want to leave you with some thinking here. We chose these chocolates for a very specific reason. In fact we hunted down the spherical chocolate that has the same height and diameter of that Hershey’s Kiss.
Your Task: What volume relationships can we pull from this image?

Did you notice the relationship between the amount of chocolate by volume Jon ate versus Kyle?
Look for an upcoming post on how we used this task to teach volume. But before we do that we want to know how you see a lesson on volume forming with this information. Use the comment section below to share your ideas, questions, comments, or even just snippets of what a lesson could look like.


Why Consistency Is More Important Than Intensity: Culture in the Math Classroom
Ok so you tried using a problem based lesson like a 3-Act Math Task or maybe you had students solve a task in groups with your brand new whiteboards and it …….flopped! Yep you’re worst nightmare was there with you in that classroom! A failed lesson! You were sure it was going to be a success. You heard that that activity was a great one but for you it just didn’t work.
Don’t worry. It wasn’t you. It’s normal. This comes down to an example of Intensity versus Consistency. I first heard Simon Sinek (an inspiring speaker and author on business and leadership) talk about this on the Tony Robbins Podcast.
Wait, what’s Intensity versus Consistency???
Ok, say I’m looking to get into shape. I want to be physically healthy and fit. Everybody knows that I can’t just go to the gym for 6 hours today and expect to instantly be fit and ripped! No one expects that. That is an example of intensity. Or consider brushing teeth. I can’t just brush my teeth once and hard and then expect my teeth to stay healthy! They’d all fall out after a while! Or let’s say reading books with my kids at bedtime. If I read for two hours before bed tonight with my daughter Lucie it’s not going to make her a better reader. Those are all acts of intensity. Brief intense moments of an event.
We know that we need to brush our teeth twice a day everyday to see results. We know that to go to get in physical shape we need to routinely work out 20 minutes a day and we will see results. We will absolutely get into shape. If we read with our kids every night then they will become better readers and better writers! We know this. These are acts of consistency.
It’s little consistent events that will make the difference not a big one-time or two-time event. But the problem is that we can’t see the benefits of the small acts in real time. I don’t see that my teeth are healthier after the one time brush or that my daughter reads any better…..I have to wait to see those benefits. And it’s hard because those benefits come at different times for different people.
When Simon talks about great leaders he says that great leaders have to build consistency and not intensity. It’s all the little things they do to create a great work culture and not the big hoopla one time event. A great leader can’t just throw an amazing holiday party and expect that to be the solution to a great work environment. They have to show acts everyday that they value their employees. That consistency will create a great work culture!
Intensity versus Consistency for Math Education:
That lesson that flopped was a one-time event! It was because we viewed it as an act of intensity. In order for those lessons to be successful and to bring out deep meaning and learning for our students we need acts of consistency. We need to do this as part of our routine.
That consistency will help create the amazing classroom culture you are dreaming of. That positive, safe, fun learning environment where kids learn with each other and with the teacher! But we have to be willing to put in the work to build consistency.
And the students are not going to be the ones to magically make this happen. We have to do it. We’re talking about middle school or high school here. Students would rather NOT talk to other peers they don’t know. We need to teach them how to help create this environment.
And It’s all the little things we do everyday that will make this happen.
- It’s the Daily Warm ups where you have kids discussing arguing defending.
- It’s routinely asking kids to struggle that teach them resilience.
- It’s your assessment routines.
- It’s the Random Grouping everyday and using Whiteboards that show them that you value their voice.
- It’s the problems you use to teach with.
- It’s how you demonstrate to your students what you value in learning.
It’s the things you do everyday that matter. Those are the things that will build the culture you are looking for. Routine and Consistency are what will drive change in your classroom and student learning.
This takes dedication. I know it’s hard so to help you out I’ve put together a handout that you can download, read and share with other teachers on 5 tips to to build amazing classroom culture. And you guessed it all of them involve being consistent instead of intense.
Click to download 5 Tips to Build Amazing Classroom Culture. 
What are your tips to build amazing classroom culture in your math classes? What are we missing? Just add those in the comments below.

How Small Nudges Could Have A Big Impact On Math Education
Do you ever notice that many decisions are secretly being made for us? You probably missed them like I did.
Consider this: Last Friday, and much like every Friday our math department headed out for a quick snack and recap of the week at one of our favourite restaurants. We enjoyed stories from a week’s worth of lessons and working with students while looking forward to new stories for the upcoming weekend. Like every Friday when it’s time to leave I get the bill. What do you notice?
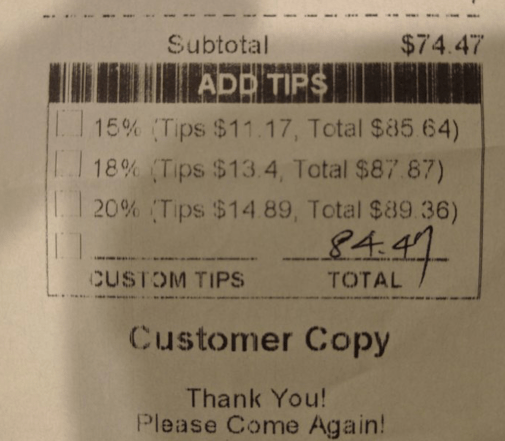
The tip was suggested for me!
I didn’t have to think too hard about what to leave. The restaurant has made it real easy for me to include that good tip. How many more tips do you think this restaurant earns compared to other restaurants that don’t have this feature? A bunch more is the answer.
Here’s another example of a subtle suggestion that has a big influence on our decisions. Have a look at this image taken at the University of Pennsylvania.

We have to do a double take and think about what side to place our trash in. We are pushed to consider our trash placement instead of just tossing it in a bin. A subtle suggestion that influences our decision. Recycle or Landfill?
Both of these scenarios didn’t just happen by accident or without careful thought, both are using a branch of behavioural economics to influence decision making called Nudge Theory.
From wikipedia: “A Nudge is a concept in behavioural science, political theory and economics which proposes positive reinforcement and indirect suggestions as ways to influence the behavior and decision making of groups or individuals.”
If we go back to the tipping example: the suggested tip amount on the bill is a small indirect suggestion for me to give a good tip. The restaurant has made it real easy to leave that tip (they did the math for me). Also notice that they didn’t provide tip amounts less than 15%. They nudged me to make a tip of 15% or greater! They nudged me to choose the behaviour that was favourable to them.
In the garbage bin example the creators drew your attention to the negative impacts of putting items in the garbage side. If you toss on the garbage side that trash goes directly to the landfill. They nudged you, very subtly, to think before you toss trash.
The basic idea behind a successful nudge is to make it very easy to do the favourable behaviour and hard to do the unfavourable one. It was easy for me to make a tip of 20% and harder if I wanted to tip less. It was easy for us to make a decision to recycle because choosing the alternative was something we generally want to avoid: filling landfills.
Nobel Prize winning economist Richard Thaler along with Cass Sunstein brought Nudges into the forefront in 2008 with their book: Nudge: Improving Decisions about Health, Wealth, and Happiness and I learned about it from the Choiceology Podcast episode: The Big Impact of Small Changes by Dan Heath. In that episode Heath outlines a great example of a nudge: the power of the opt-in versus the opt-out.
In Austria, more than 90% of their citizens are organ donors. In the neighbouring country Germany? Less than 15%. Are Austrians that much more conscience about organ donation? Nope. In Austria citizens are auto-enrolled in the program and have to opt-out if they would rather not be a donor. In Germany you are not auto-enrolled and have to opt-in to be a donor. That’s a nudge! A small subtle change can have big outcomes in decisions. Auto-enrolling capitalizes on our laziness factor. It’s easier if we do nothing compared to doing something.
“It’s a question of putting the best outcome along the path of least resistance and letting your automatic system do its thing.” Mark W Riepe writes regarding nudges.
What implications does Nudge Theory have in the math classroom?
Nudging in Math Education
In my opinion one of the most poorly designed calculator features on my smartphone is the percent button.

Students often misuse the % button the calculator and are not sure what is going one behind that it. It’s like a black box of percent calculation. Many misconceptions arise in my grade 9 applied class when students use this button without knowing the math behind it.
Compare that to what Desmos is doing.

Desmos has auto-added the word “of” after the percent symbol. There is no way for a student to delete the word of. It’s stuck there. It forces us to think about how we use that button. Both teachers and students are now auto-enrolled in finding the percent of a number before doing anything else. It’s an amazingly small change that has a huge impact on learning. They have made it easy to do the right thing. And impossible to do the wrong thing. That is a nudge!
Have you seen these charging stations for phones in classrooms?

Teachers are making it super easy for students to choose to put their phone away if it’s a distraction to their learning. A student will gladly get the juice and put that phone away for an hour. Nudge!
I want students to regularly self assess their learning in my classroom. I want them to be more accountable to get what they need. I make it very easy for them to see their own progress on the learning goals in our course. By auto-enrolling them in their Freshgrade portfolios student can access all the learning goals anytime and work towards showing improvement on them! It’s my way of giving them a nudge to make good decisions regarding their assessment.
What kind of nudges are you trying?
What are you doing to make the right behaviours easy and the wrong ones hard? What are you doing to affect choices your students make in your classroom?
