True/False
Indicate whether the
statement is true or false.
|
|
|
1.
|
If the correlation coefficient is negative, the relationship slopes downward to
the right.
|
|
|
2.
|
A data set with r = 0.9 has a stronger fit than a data set with r
= –0.9.
|
|
|
3.
|
An outlier can reduce the accuracy of a linear model.
|
Multiple Choice
Identify the
choice that best completes the statement or answers the question.
|
|
|
4.
|
Which value of r would be appropriate for the scatter plot shown? 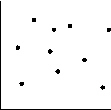
|
|
|
5.
|
Which value of r would be appropriate for the scatter plot shown? 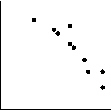
|
|
|
6.
|
The scatter plot shown includes an outlier in the upper left corner of the
graph. The line of best fit is shown. 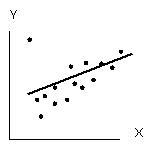 How would the line of best fit be
affected if the outlier were removed? a. | The slope would decrease and remain positive. | b. | The slope would
decrease and become negative. | c. | The slope would increase. | d. | The slope would be
unchanged. |
|
|
|
7.
|
Which error in the use of linear regression might be present? 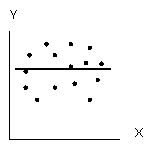 a. | too few data points | b. | an outlier was not removed from the data
set | c. | the model is not linear | d. | all of the
above |
|
|
|
8.
|
Which error in the use of linear regression might be present? 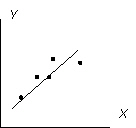 a. | too few data points | b. | an outlier was not removed from the data
set | c. | the model is not linear | d. | all of the
above |
|
|
|
9.
|
Using a linear-regression equation to predict values between actual data points
is an example of
a. | extrapolation | c. | least-squares fit | b. | residuals | d. | interpolation |
|
|
|
10.
|
For the line of best fit in the least-squares method,
a. | the sum of the squares of the residuals has the greatest possible
value | b. | the sum of the squares of the residuals has the least possible
value | c. | the sum of the residuals is equal to one | d. | both b) and
c) |
|
|
|
A university conducted a study to compare first year class sizes with average
marks. Ten classes were selected at random. The results are shown in the table.
Class
Size,
c |
123 |
102 |
88 |
95 |
147 |
75 |
43 |
110 |
98 |
176 |
Mean
Mark, m |
64.9 |
69.4 |
72.2 |
58.0 |
62.1 |
73.0 |
74.5 |
66.3 |
69.8 |
60.1 | | | | | | | | | | | |
The line of best fit has equation m = –0.114 c +
79.085 with r = –0.743
|
|
|
11.
|
Classify the linear correlation.
a. | strong, positive | c. | moderate, positive | b. | strong, negative | d. | moderate,
negative |
|
|
|
12.
|
Which data point might be considered an outlier?
a. | (102, 69.4) | c. | (176, 60.1) | b. | (75, 73.0) | d. | (95, 58.0) |
|
|
|
13.
|
For a class size of 147 students, the model predicts a mean mark of
|