How We Can Avoid a Major Lesson Planning Misconception

One common misconception around how we should plan our lessons is that planning and creating lessons, course outlines, and assessments is all done in isolation.

There’s an iconic image of famous Fiction authors shutting themselves up in a cabin in the woods for months at a time and then emerge with this great manuscript.

This is actually a false image.

Most authors go through intense iterations of their books with many editors and audiences that provide feedback.

You many have this image that math lesson creators also lock themselves up in the teacher prep room to think up great lesson ideas only to miraculously emerge with perfect lessons. Or maybe you believe that we have magically created spiralled course outlines all by ourselves with little input from anyone else.

These things can’t be further from the truth. Every one of the lessons shared on this site and also any unit or course plans were all created in consultation with other teachers.

In fact, when Kyle Pearce and I first decided to change our course plans from the traditional textbook order to mixing up topics so we can maximize student retention through spiralling our math lessons, we created a joint outline with Google Sheets that we could each have input to. Planning lessons and courses should be collaborative effort.

In January 2018 I asked the twitter community “Your colleague is thinking of trying to teach through spiralling the curriculum. What are some SMALL changes they can make NOW so that’s it’s not overwhelming?”

Many teachers gave their suggestions but one comment really stuck with me, It was from Mary Bourassa,

She said,

“Lots of great replies but I would argue that most are not small changes. Switching to spiralling is a big change! My best advice is to plan a meeting with someone who has spiralled so that you can talk through your plan together. And make sure you know the curriculum really well.”

We need other people on our same teaching journey as we learn to create new lessons that meet our students need.

A book I highly recommend reading because it’s interesting with many great real-life stories and examples is The Creative Curve, How to develop the right idea at the right time. By Allan Gannett.

The main idea of this book is, and quoting from the publisher,

We have been spoon-fed the notion that creativity is the province of genius — of those favoured, brilliant few whose moments of insight arrive in unpredictable flashes of divine inspiration.  And if we are not a genius, we might as well pack it in and give up. Either we have that gift, or we don’t. But Allen shows that simply isn’t true. Recent research has shown that there is a predictable science behind achieving commercial success in any creative endeavour, from writing a popular novel to starting up a successful company to creating an effective marketing campaign.

One of Gannett’s Laws of creativity is the law of creative communities. He argues that creatives leaders like Paul McCartney, Steve Jobs, and  J.K. Rowling, didn’t create their great works in isolation, but were surrounded by a community of people. Gannett’s also argues that if you don’t have a community of supporting people around you then your chances for creating something is drastically reduced.

So, if you want to make math moments that matter for your students on a regular basis then you will need a community of supportive people!

Alex Overwijk is a high school math teacher in Ottawa Ontario Canada. What I admire so much about Al, is that after teaching math the “traditional way” for over 25 years he realized that he had been robbing his students of great thinking and made significant changes in his classroom routines with an emphasis on “Uncovering curriculum instead of covering curriculum”.

Al has written on his blog slamdunkmath.blogspot.com about Lesson study — a collaborative lesson design structure — that has led him to create many active great thinking lessons for his students.

Basically, lesson study in a nutshell is a group of educators, teachers, and administrators who will together plan a lesson for a teacher to deliver. They will all observe to witness how the students respond to the questioning and tasks included in the lesson, then they debrief to make changes. Then this process repeats. The group will plan, observe, and debrief for another teacher, and so on.

The group is planning lessons collaboratively, not in solitary isolation. The success/ or failure of the lesson is felt by the whole group and not just from the teacher delivery it.

When responding to teachers who say “I can’t afford to be out of my classroom that many times”…. Al says, “How can you not afford it? Your classroom will become a different place-a place you’re not familiar with. Your instructional practices will be challenged and will probably change as a result. Your belief in what students can do will change. You need to try this!”

Al and so many other teachers know that the success of great lessons and course plans can hinge on your access to a community.

What can you do? —- Find one or two teachers who also want to plan, talk ideas through, and collaborate on lessons or course designs. Please. Don’t do this alone. We need to avoid isolation. Sharing ideas, strategies and resources is how plans not only get created but how we stick to them.

Your next step to avoid Teacher Isolation → Join our closed Facebook group: Math Teaching & Learning K-12.  It’s closed so that you can feel comfortable asking math lesson related questions on Facebook without bothering your Aunt or your college friends with math related stuff. It’s a place just for us! It’s a place where if you’re feeling teacher isolation in your school come here and share your question or even just to vent. 

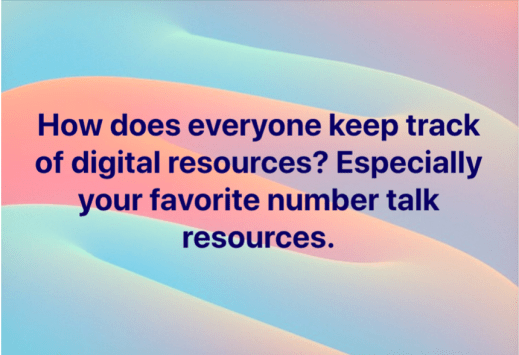
For example, a group member asked the following question….and other group members jumped in to help out.

Or here’s another example of a team effort

So, I’m hoping to see you in group! Remember, don’t do this alone! We can create better things together. 

Pumpkin Time-Bomb Activity

For the last few years  I’ve shared out a Google Form for classes to record measurements around their pumpkins and make them explode! I shared that form on Twitter so that we could crowd source as many pumpkins as we could to make the sample size large enough. I was pretty shocked at how many schools from North America took on Pumpkin Time-bomb. By the time Halloween was over the spreadsheet had over 90 entries. That’s over 90 pumpkins exploded in the name of math and data collection.

[Update] – October 2018 – The form now has over 500 entries!!

This coming week let’s add to the data and use the it in our classroom to discuss: Scatterplots, Trends, Correlation strong, weak, no-correlation, lines of best fit, correlation coefficient, etc.

Here’s a sample lesson you could use on the day you make your pumpkin explode.

SPARK Curiosity

Play this video which shows Jimmy placing rubber bands around a pumpkin.

NOTICE & WONDER

Using a notice & wonder strategy, have your students record anything they notice and anything they wonder from the video.

ESTIMATION:

Steer you class’ wonders toward the questions: How many rubber bands will make the pumpkin explode?
Have students write down a guess that is too low. Too high. Then estimate their best guess.


If you’re looking for your lesson goal to be around estimation then show the act 3 video next, but if you’re looking to go further and tackle a learning goal around Using scatterplots, lines of best fit, or linear regression jump down the post.

Show the Act 3 Video


Using Scatterplots & Trends to Improve Your Prediction. 

Alternatively, to Spark Curiosity you could use this pre-made Desmos Activity! which allow you and your class to follow a Curiosity Path.


WITHHOLDING INFORMATION to create ANTICIPATION: 

Use the PAUSE tool on the activity to lock their screens while you show your students the video on your main screen. Encourage your kids to discuss what they notice and wonder from the video! In pairs, I have my students TALK first and then TYPE second when collaboratively working on a Desmos activity.

ESTIMATION:

Consider pausing the screen again while you use the snapshot tool to grab student responses! This will lead into predicting how many bands will make Jimmy’s pumpkin explode. Have your students TALK first and TYPE second on screen 2 to make a prediction. Again, share students predictions using the conversations tools Desmos provides.

FUEL SENSE MAKING – IMPROVE YOUR PREDICTION: 

Bring your students down the curiosity path a little more. Ask them about how we can improve our predictions? What other information would you like to know about the pumpkin or the bands?

Have a discussion on variables & relationships. Write all the variables on the board they come up with. Narrow down the list to items that are measurable with the pumpkin we have in the class. What affects the explosion the most? Height, diameter, circumference, thickness of the wall?

Using the PACING tool in Desmos move your students few the next few screens to make a scatterplot prediction of the relationship between the diameter of a pumpkin and how many bands will make it explode.


Screen 5 shows a scatterplot of pumpkins that have already been blown up and the relationship between diameter and bands (or non relationship). Have your students move the orange point to a place that helps them predict the number of bands. What placement would be wrong?

The next few screens ask your students to do that all over again while looking at the relationship between the height of the pumpkin and the number of bands.

Finally, reveal the answer after students have improved upon their predictions.

Now Bring out your pumpkin for the class to see! Have them predict how many rubber bands it will take before it will explode. Repeat the estimation process. Have them save their guess till the end of class. Where will YOUR pumpkin fit on the scatterplots shown in the Desmos activity?


If you are not planning on using the Desmos activity then you can use the original activity post from October 2015.

FUEL SENSE MAKING – Making A Model

Throw out the question: “What about the pumpkin do you think affects how many rubber bands are used to make it explode?” Let your students brainstorm a list of variables. Have a discussion on variables & relationships. Write all the variables on the board they come up with. Narrow down the list to items that are measurable with the pumpkin we have in the class. What affects the explosion the most? Height, diameter, circumference, thickness of the wall?

Screen Shot 2015-10-24 at 6.34.42 PM

Have them choose a variable that they feel should have a relationship with the number of rubber bands. Fill out the prediction part of the handout.

Screen Shot 2015-10-24 at 4.54.15 PM

Click here to grab a copy of the prediction handout

As a class measure all variables needed. Write them on the board for all to see.

FUEL SENSE MAKING – Analyzing Data

Give students the link to the spreadsheet of all the pumpkins to date (You should copy and paste the data to your own sheet so you can filter/sort the results and share that sheet out to your students.)

Discuss with your students the lack of consistency in the selection of rubber bands from all over the country. How can we minimize this variable skewing our results? Filter the data with your students(or before hand) showing one type of rubber band (Most common is a rubber band of length 8.65 cm). This will only show all the pumpkins that have been destroyed using that type of band.
Screen Shot 2015-10-24 at 2.48.38 PM
Get your students to grab the data that relates to their relationship.

For example:
If Kristen chose the relationship Circumference vs. Rubber bands she should copy and paste the circumference column and the rubber bands column into a new sheet side by side. Then copy and paste all that data into the pre-made Desmos File.
Screen Shot 2015-10-24 at 5.14.57 PM
She can adjust the scale in Desmos as needed. Have her move the movable point and drop it where she thinks your class’ pumpkin will lie. Or you can have her find the line of best fit to help predict how many rubber bands it will take. Either way we want her to predict with more accuracy.

Screen Shot 2015-10-24 at 5.17.17 PM

So Kristen would predict that if her circumference was 90.5 cm then it will take 272 rubber bands to blow up the pumpkin!

Screen Shot 2015-10-24 at 6.28.55 PM

Now if Kristen chose a variable that it was clear there is no relationship then you get to have a discussion about correlation vs. no correlation. Have her choose new variables to predict on.

Once everyone in the class has a new prediction start wrapping bands around that pumpkin (You may want to start this as early as possible).

Watch your pumpkin explode and give congratulations to the student who predicted closest to the actual number of rubber bands.

Don’t forget to enter all your data to the sheet by filling out this form (you can also use the form to show the videos to the class).


[Updated] – You can use this Desmos Activity Builder Activity to facilitate the lesson. It includes only data for Diameter and Circumference.

[Updated] – You can grab a copy of the spreadsheet to save in your Google Drive. From here you can modify. 

Access the Form

Access the Data

From Oct 30. 2015

A few pumpkins from 2014 & 2015

Eye To Eye – A Similar Triangle Problem

Here’s a common similar triangles application problem that shows up in most middle and high school textbooks. A mirror is placed on the ground between two objects, showing two triangles with a bunch of measurements given and we’re supposed to find the height of one of the objects. 

A typical approach to showing how this problem is modelled with similar triangles is to walk students through a full solution. 


In lesson 1 of the video series that Kyle Pearce and myself have shared to make math moments that matter in your class we outline how why and how we can reshape our lessons to become more curious. If you haven’t yet watched the video series go ahead and watch video one now!

 Let’s take this similar triangle problem and remodel it so it follows a Curiosity Path so we can fuel student sense making with similar triangles. 

Recall that the first part of changing a problem to include more curiosity is to determine how you can withhold information to create anticipation. 

Here’s my attempt at doing this for our students. 

Have your students set up their page or whiteboards to record what they notice and what they wonder after watching this very short video clip. 

After discussing what students notice and wonder, bring out the wonder (if your students didn’t already) — Will they see eye to eye through the mirror?

Allow your students to analyze the video again and have them predict if they could see eye to eye. Then hit them with these three images one at a time. 

For each image, ask them to predict the answer to: Can Danielle and Dylan see eye to eye? Which image is it easy to see that the two can’t see eye to eye? Which image is harder?  Why is it easier in one image over another? Have your students draw a picture to show you why Danielle and Dylan can’t see eye to eye in the second image? To bring students down the curiosity path a little further and deepen their investment into this problem ask them to predict where Dylan SHOULD stand so that they can see eye to eye. 

What information is useful to know? Hearing your students insights at this moment is fuel for your formative assessment of their understanding and their problem solving toughness. When a student asks for the Danielle’s distance from the mirror ask “What would you do with that information if I gave it to you?”  Listen closely to the answer of that question. You will discover quite quickly who is anticipating possible strategies and the reasonableness of those strategies and who’s strategies will need some assistance. Consider giving Danielle’s distance from the mirror to help update their prediction. 

You can reveal the information as students request it. 

Now that we’ve build up student curiosity by bringing them down the curiosity path we reach the fork in the road we outlined in Video 2 and 3 of our series. We can either rush to an algorithm or we can keep following the path towards making a math moment that matters. 

In this activity we can fuel student sense making by having students experience what it’s like to see eye to eye. Students can mimic what they saw in the video to see how far a partner should stand away a mirror so the two partners will see eye to eye. 

Students will arrange themselves as shown in the activity handout, determine how far one partner must stand to see each other in the mirror, then they test that distance to see if they actually see each other! Students will collaborate, peer and self assess, be active, and engage in purposeful practice. 

Finally, students re visit the three scenarios presented at the top of the lesson to determine if Danielle and Dylan will see eye to eye. They essentially will prove if the triangles are similar or not. 

An alternate or extension problem students can work on is “Where should we place the mirror so that they do see each other eye to eye? 

Download
ALL LESSON FILES

Grab the handout, images, and video files for your classroom!

SHARE THIS ACTIVITY!

Facebook
Twitter
LinkedIn
Pinterest

A Squiggle-Line Dilemma: How Creating Bends Gives us Freedom in Planning

Have you read one of my all-time favourite books The Dot and the Line: A Romance in Lower Mathematics by Norton Juster? It’s not a new book it was originally written in 1963.  I not only read it to my classes on Saint Valentine’s Day but I gave it to my wife as a present way back on our first valentine’s day together.

I love that every time I read it it makes me reflect on who I want to be as a human and also as a math teacher!

If you haven’t read it you can watch the Academy Award winning Short Animation by Chuck Jones right here, now! Watch it before reading the rest.

Lately I’ve been thinking about this story as it relates to how we math teachers feel the need pursue the “perfect” math lesson or that shiny new tool/technique we hear we should try.

We seem to be after the perfectly engaged class (behaviourally and cognitively) learning the chosen standard at just the right pace for all students. And why shouldn’t we? It sounds great. But, what is the likelihood that we’ll ever achieve this “perfectness”. The reality is that teaching is messy; all classrooms are different.

We see so much positivity on the internet and from our peers. Looking at twitter or blog posts suggests that so many teachers are having these perfect classes or that the shiny new tool/technique solves all our problems. And it leaves us sometimes feeling inferior and overwhelmed.

I think some of us feel that we need to be using that iPad, or new tech tool, or shine new learning model everyday to create this perfect happy class.

Let’s relate this situation to The Dot and the Line story.

Imagine for a moment that you are the main character from the book; the line. The dot is ….. well, the dot is that “perfect” class lesson where all students are using that new shiny tool or technique that we’re not quite sure about.

When the line first meets the Dot and sees that “she” only has eyes for the whimsical squiggle, the line feels that “he” needs be more like the squiggle.

Many of us teachers also feel or have felt that we have to become the whimsical squiggle to win the dot to our side. We feel that we have to become not just entertainers, but we have to become someone we are not. Many teachers also feel that we have to give up core beliefs on what creates good a good learning moment so we can have this other, supposedly great learning tool or technique. 

But that’s not true.  We don’t need to change our core beliefs of what creates great learners. We don’t need to give up on teaching students dedication, determination, and rigour to bring in curiosity, creativity and openness into our lessons.

For example, some math teachers believe that by teaching through problem solving with tasks like Popcorn Pandemonium, or Kyle Pearce’s Candle Burning problem you HAVE to sacrifice procedural fluency.  They believe that you can’t have both mathematical rigour and learning through problem solving. You either have to be a squiggle or a straight line. They believe it’s one way or the other.

What I believe is that we may have to BEND, just like our pal the Line to truly create math moments that matter for our students.

Like the line, Bending gives us permission that it’s not an all or nothing transformation. We don’t just have to choose between a squiggle and a perfect line.

Like the line, bending means though that we may have to work harder and smarter.

Like the line, bending means that we can teach through problem solving as well as getting students the practice they need to become fluent without sacrificing time.

Like the line, bending means that we can recreate ourselves — in a stronger way that supports learning.

Bending means that we need to actively think about how we can incorporate our core beliefs of good learning in our lessons while meeting the needs of ALL our students.

To address one common Line vs. Squiggle comparison:

How do we incorporate practice and procedural fluency in lessons while building resiliency in problem solving — without sacrificing time?

I use purposeful practice routines that encourages student discourse, self assessment, peer assessment, movement, and error checking that bring my students closer to procedural fluency after we’ve used productive struggle to learn a topic.

Download and learn more about 5 practice structures I highly recommend you add to your practice routines. 

Download Now!
5 Practice Structures in Math Class

Learn about 5 of my go-to practice structures for self assessment, peer assessment, movement, and error checking!
Facebook
Twitter
Email
Pinterest