Eye To Eye – A Similar Triangle Problem

Here’s a common similar triangles application problem that shows up in most middle and high school textbooks. A mirror is placed on the ground between two objects, showing two triangles with a bunch of measurements given and we’re supposed to find the height of one of the objects. 

A typical approach to showing how this problem is modelled with similar triangles is to walk students through a full solution. 


In lesson 1 of the video series that Kyle Pearce and myself have shared to make math moments that matter in your class we outline how why and how we can reshape our lessons to become more curious. If you haven’t yet watched the video series go ahead and watch video one now!

 Let’s take this similar triangle problem and remodel it so it follows a Curiosity Path so we can fuel student sense making with similar triangles. 

Recall that the first part of changing a problem to include more curiosity is to determine how you can withhold information to create anticipation. 

Here’s my attempt at doing this for our students. 

Have your students set up their page or whiteboards to record what they notice and what they wonder after watching this very short video clip. 

After discussing what students notice and wonder, bring out the wonder (if your students didn’t already) — Will they see eye to eye through the mirror?

Allow your students to analyze the video again and have them predict if they could see eye to eye. Then hit them with these three images one at a time. 

For each image, ask them to predict the answer to: Can Danielle and Dylan see eye to eye? Which image is it easy to see that the two can’t see eye to eye? Which image is harder?  Why is it easier in one image over another? Have your students draw a picture to show you why Danielle and Dylan can’t see eye to eye in the second image? To bring students down the curiosity path a little further and deepen their investment into this problem ask them to predict where Dylan SHOULD stand so that they can see eye to eye. 

What information is useful to know? Hearing your students insights at this moment is fuel for your formative assessment of their understanding and their problem solving toughness. When a student asks for the Danielle’s distance from the mirror ask “What would you do with that information if I gave it to you?”  Listen closely to the answer of that question. You will discover quite quickly who is anticipating possible strategies and the reasonableness of those strategies and who’s strategies will need some assistance. Consider giving Danielle’s distance from the mirror to help update their prediction. 

You can reveal the information as students request it. 

Now that we’ve build up student curiosity by bringing them down the curiosity path we reach the fork in the road we outlined in Video 2 and 3 of our series. We can either rush to an algorithm or we can keep following the path towards making a math moment that matters. 

In this activity we can fuel student sense making by having students experience what it’s like to see eye to eye. Students can mimic what they saw in the video to see how far a partner should stand away a mirror so the two partners will see eye to eye. 

Students will arrange themselves as shown in the activity handout, determine how far one partner must stand to see each other in the mirror, then they test that distance to see if they actually see each other! Students will collaborate, peer and self assess, be active, and engage in purposeful practice. 

Finally, students re visit the three scenarios presented at the top of the lesson to determine if Danielle and Dylan will see eye to eye. They essentially will prove if the triangles are similar or not. 

An alternate or extension problem students can work on is “Where should we place the mirror so that they do see each other eye to eye? 

Download
ALL LESSON FILES

Grab the handout, images, and video files for your classroom!

SHARE THIS ACTIVITY!

Facebook
Twitter
LinkedIn
Pinterest

Fuel Sense Making & Black Box Defrost

Sparking Curiosity:

I put this video on infinite loop while the students filed into the class. I let it play and said “here is your warm up today”

Reading this post in your email and can’t see the video above? Click here to the post page.

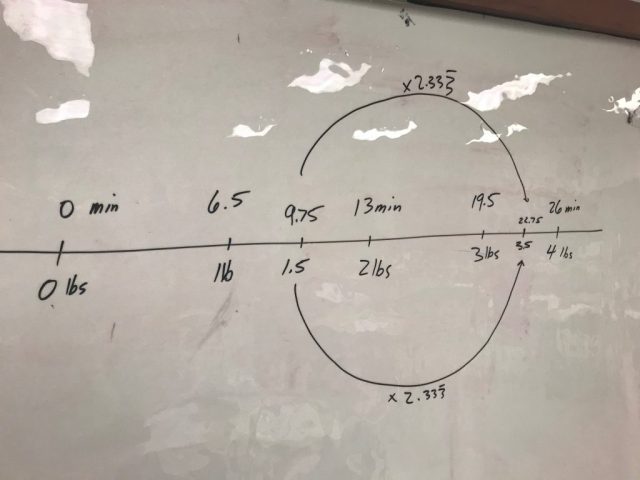
I said nothing else. I was letting the curiosity build. After it looped and looped students started to work. Without saying a word about it students were trying to find how long it will take to defrost an item that weighed 3.5 pounds.

Igniting MY Moves:

Since I routinely let students struggle to solve problems instead of showing them immediately a “how to”, I have to be ready to give feedback on what they try on the fly. I want to help push them in not only a direction that solves the problem but prepares them to see solutions that are not their own and solutions that attempt to address our learning goal for that day. That takes careful planning which is not an easy thing. 
Plan with Precision so you can proceed with great flexibility” – Tom Schimmer.
When I first started teaching so much of my planning was solely focused on answering questions like, What topic? What examples?, and How long do I spend on it? Now my planning time is mostly spent trying to answer: How will the students solve this problem? How can I use what they will do to shape the lesson? What do their attempted solutions tell me about what they have learned so far? So my planning process has gone from examples like this where I was so concerned with WHAT….
to spending most of my time thinking about HOW. HOW will the students respond to the task? What does that look like? That takes a ton of anticipation. Anticipating their solutions and strategies puts me in a better position to understand their thinking and help shape that thinking. For each possible attempt I need to be ready to provide feedback to help them achieve our goals.
For the Defrost Black Box problem from above the learning goal I am hoping to pull out is “Relations can be represented in various ways” and “Problems can be solved in a variety of ways” I anticipated that some of my students would attempt to solve it with a unit rate.
Possibly some of my students may solve it with a table of values and linear relation.
Some may set up a proportion.

The book 5 Practices for Orchestrating Productive Mathematics Discussions has been an invaluable guide to help me re-design my planning time.

Fuel Sense Making

Since my goal is for students to see “Relations can be represented in various ways” and “Problems can be solved in a variety of ways”
I need to be ready to fuel their sense making by linking the different student strategies together.
Here are some of what the students tried.

I did not anticipate students using seconds.

I also did not anticipate students using additive thinking with the unit rate.

We learn so much from our students by allowing them to show their thinking. Imagine all the missed conversations with my students from 2005 – 2013. Imagine how many of my students felt like they were failures because their brains didn’t tell them to solve those problems the same way the I did. When in reality they had so many good insights that just needed to be tailored.
Selected students presented their strategies to the class. Now it was time to show how their strategies connect together.
We showed how the unit rates that many of them found and used showed up the table solution.
We moved from there to show how this would be represented on our number lines. 
Yes the planning that comes from Igniting My Moves and Fuel Sense Making takes time and it is not easy. But I can tell you that it is worth it.
On a side note: Help me settle a problem. A teacher said, “Students might find a real microwave more engaging than the fake one you have shown.”
Is version 2 of the Black Box Defrost more engaging or worth doing more because it is real? What are your thoughts?
Version 2: The More Real version

Reading this post in your email and can’t see the video above? Click here to the post page.

Thanks for reading!

Polygon Pile Up

When it comes to angles involving parallel lines, triangles, and other polygons I’ve always assumed my grade 9 applied students “get this”. I’ve felt that angles were an easy topic. I guess I thought this because most students seem pretty happy when solving angle problems and for the most part being doing pretty well on assessments. However, this year I noticed two inadequacies that I am trying to address.

  1. Most of my students didn’t actually know what an angle measurement of 65 degrees really means.
  2. They have a hard time determining what information is needed when solving multi-step angle problems. Lack of a good strategy.

Addressing #1

When having students determine angles in triangles almost all of them knew that all three angles should add to 180 degrees. The trouble came when I saw some answers like this (from more than one student). 

What bothered me was the location of the 40. I wondered why outside the triangle? I pressed this student for more info. I asked him to draw me any right triangle and label the three angles.


Hmmm…I asked him to point to one of the angles. He pointed to where he labeled the 85. What I found is that this student was mixing up length measurements with rotational measurements and he was not alone.

I found a great activity to hit this head on. Laser Challenge from Desmos worked wonders to get my students to understand and experience rotational measurements. Students have to enter values to rotate the laser and mirror to hit targets.

My students “felt” what 60 degrees is. Experiencing that rotation made all the difference to clear up what we were actually measuring. When second semester rolled around and my new crop of kids came in we started with this activity right away.

Addressing #2

Most of our students struggle with solving complex problems where they have to think of a strategy. Before I gave them something like this,

I wanted to them to experience what information would be useful to know first. I decided to turn the problem around and inside out.

I gave them this.

I wanted them to think backwards….just like we need to do sometimes when solving longer problems. On the “easy” side most filled in 3 angles in the quadrilateral. What was great was that prepared them to think what we could leave out for the harder one. This simpler diagram challenged my class to think, plan, and strategize!

It was great to do this before we introduced this puzzle Jim Roesch, Kristyn Wilson, and myself created:

[There is a video embedded here — Can’t see it? Click through to the post page]

Here is the puzzle

Click to download a PDF copy to print.

And to really challenge yourself or your students here is a blank one. Can you fill it in so it’s “hard” to determine that indicated angle? What is the least amount of info you can give to bring out the most amount of thinking? Share them out! 


Turbo Texting

The original idea for this lesson came from Al Overwijk. Thanks again Al!
The possible Ontario overall curriculum expectations covered in the activity:
  • Grade 10 applied:
    • graph a line and write the equation of a line from given information
  • Grade 9 applied & academic:
    • solve problems involving proportional reasoning;
    • apply data-management techniques to investigate relationships between two variables;
    • demonstrate an understanding of constant rate of change and its connection to linear relation
  • Grade 8:
    • solve problems by using proportional reasoning in a variety of meaningful contexts.
  • Grade 7:
    • demonstrate an understanding of proportional relationships using percent, ratio, and rate.
  • Grade 6:
    • demonstrate an understanding of relationships involving percent, ratio, and unit rate.

Act 1: Turbo Texting:

I started with “I was with my brother one afternoon and I needed to text my wife. After texting her, my brother informed me that I was a ‘terrible texter’. He said I was soooooo slow. I on the other hand disagreed. Then we decided to settle this once and for all—- race!!!”

If you’re viewing this through email you may have to click through to see the video

What do you notice? What do you wonder? Allow students a few minutes on their own to jot down their ideas. Then share with partners, then the class.
Here are a few questions/tasks I asked them next. I wanted to slowly build into deciding if this relationship was proportional.
  • What relationships can you see? — Number of characters in a text vs. the time to text it.
  • Create a scatter plot sketch of how the number of characters in a text affects the time to text that message.
  • How does this graph look with both texters on the same grid?
  • Who is the faster texter? Predict. How does your sketch show who is faster?
  • Kevin finishes first does that mean he is the faster texter?
  • How will we determine who is the faster texter? What will we need to see?
We took our time with these questions so we could develop and understand the relationship between characters in a text and the time to text it.

Act 2

If you’re viewing this through email you may have to click through to see the video

ME: “Use any method you choose to determine: Who is the faster texter?” I allowed them time here to work on a strategy. I watched carefully what strategies they used or didn’t use.

Seeing the different strategies gave us a nice discussion the importance understanding what rate we are determining and how to interpret it to answer the problem.

I showed this picture next:

and this piece of info…

Students completed this problem and we discussed the assumptions we needed to make.

Texting Time

How do your students compare to Jon and Kevin? Have them time each other while texting the 165 character message. Have them determine their texting speed to see who the fastest texter is in the class.

Linear Modelling

ME: “Now you may have texted that message in 18 seconds, but would you do this all of the time? Would you keep that same rate for a shorter message? Longer message? We better keep this experiment going.
I set them off to text various messages of different lengths using this handout (I modelled the handout format after Mary Bourassa’s Spegettini and Pennies handout – thanks Mary).

Click to download a copy

Students used Desmos and the regression tool to create a linear model. They used that model to predict how long it would take to text 140 characters, 200 characters, and this message: “Dear Mom and Dad I promise to never text and drive.” They finally timed themselves to compare the calculated time and the actual time.
Extension: Compare the relationship between the number of words in a message and the time to text the message. How would the equation change? Is it still proportional?