Puzzling Dimensions

I wanted to grab some thoughts from you on a possible lesson idea.

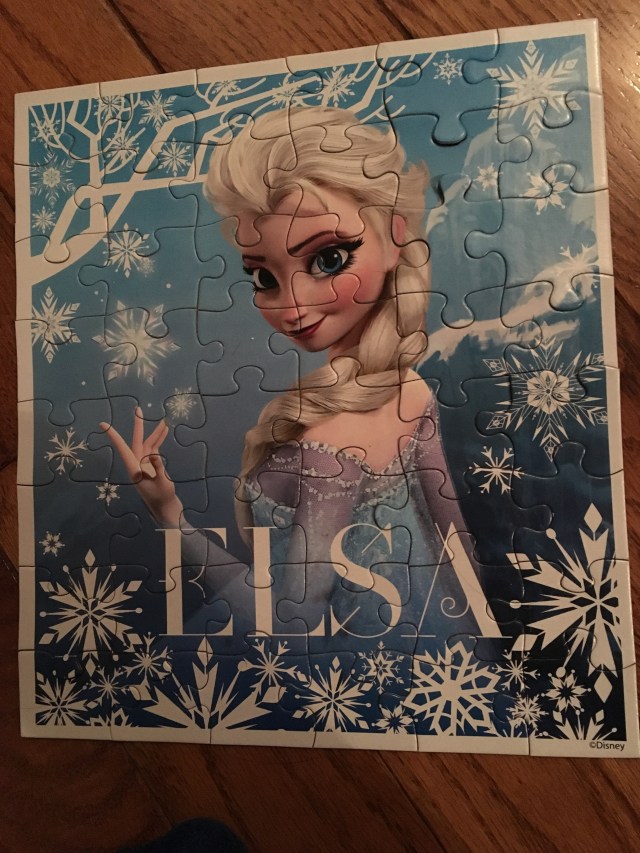
On the weekend Jules and I worked on some puzzles. After we dumped the puzzles out I would ask her how big will the puzzle be? She would look up, and with that wondering look say …”pretty big” or “not too big,” but nothing exact….she’s only 6. I narrowed the question down. How many pieces would be along the bottom? Along the side? And she would make a guess. We would do the puzzle and then find out.

This got me thinking.

I was thinking about factors of numbers and how that relates to the dimensions. I also thought about optimal dimensions of rectangles given a set area.

If a puzzle had 60 pieces what could the dimensions be? 100 pieces? 1000 pieces? 

Take Elsa for example. With 48 pieces do you know what the dimensions will be? Think of some possible combinations. Got them? 


And….. bam! Did you think of 8 pieces by 6 pieces? 


The puzzle we worked on had 100 pieces and it was a 10 piece by 10 piece puzzle.
fullsizerender-10

I feel like there is a lesson here but I’m not 100% sure where it fits. It may fit in many places.

If Act 1 is a short clip of us putting a puzzle together like below, then how does the rest of the lesson go? How do you see the rest of the lesson play out if you teach Kindergarten? Primary grades? Middle school? High school?

I would love to hear your ideas on the lesson goals as well as the lesson format! Together we can do it!

Animated Patterns Gallery Walk

A major expectation for our grade 9 applied class is to “connect various representations of a linear relation, and solve problems using the representations.” Early in the spiralled grade 9 course I bring in Fawn’s Visual Patterns website as warm ups. We routinely continue the patterns, create tables, equations, and graphs to show the representations. Students also create their own patterns.

img_0584

More and more I notice that grade 9 applied students don’t see what I see when looking at patterns (which is definitely not a bad thing). I love hearing all about how students see the patterns. However, I always see the patterns as growing/shrinking…..what I mean is that I see that one shape morphing into a bigger/smaller version. What I’ve heard from some students though is that they see each figure as a separate object, separate things that looks slightly different. I wanted to explore if students seeing the patterns morph instead of seeing them as separate objects could help them with seeing connections among the different forms of the relation.

To start the class I showed this video:


I asked: What do you notice?
Students described the pattern to each other while sitting in pairs. We decided that if the first set of shapes represented figure 1….then every figure after that showed two more shapes being added in. I asked them to go ahead and find out how many shapes were in figure 108.

I gave out the following set of instructions:

  • Create your own animated pattern video
  • Create a tough pattern for your classmates to discover. Ex: Show how the pattern changes in other ways than figure 1 then figure 2 then figure 3. Maybe show how your pattern changes from figure 1 to figure 3 then figure 5.
  • Create a question for your fellow classmates to solve about your pattern.
  • Display your video around the room for a gallery walk. In your display hide the table and equation and answer to your question.

They went to work on building & shooting their patterns. Having them skip figure numbers made them really think about how to create their patterns and how the equations related. Since they were invested in their own patterns they worked hard at creating the tables and equations.

img_2505 img_2504 img_0822

After they created their video they were to create a display for a gallery walk. The gallery walk gave us a purpose to practice finding rates of change, determining equations, generating equations and solving problems. We wanted to see the creative patterns from our classmates and see if we could solve each others problems. Like a challenge! Each display showed the video and then under flap of paper was an answer to a problem with a table and equation. Students left their display and visited each others displays with a recording sheet.

img_2510


img_0828 img_2508 img_2507


img_2506

We spent two class days working on building the videos/patterns and the gallery walk. There are a variety of stop animation apps on the app store. My students used various different ones. Some students used iMovie.

I felt students were stronger on knowing why we need to find the rate of change for our equations and not just take the first difference value. The one-two combo of actually building the patterns and then making them move through animation built a deeper understanding of the representations than just completing a worksheet!!


Favourite & Fix: Nov. 11

For the Favourite & Fix series each week I’m posting one idea from my lessons that was my favourite and one topic that I need help on. A topic I hope to fix. I’m hoping that in the comments or on Twitter #Fav&Fix you amazing readers can help me out with some hints, tips, and suggestions.

Favourite:

This week I introduced the unit circle to my MHF4U class. I wasn’t happy with the way I introduced the circle in years past so I made a change. I want students to see that our special triangles are just reflected around the circle. Instead of drawing them, or imagining that they are reflected….I wanted them to physically pick them up and flip them and move them. I wanted them to see that the lengths are the same. So I cut out 30-60-90 triangles and 45-45-90 triangle each having a hypotenuse of 10 cm. I created a circle with radius 10. Now each time you place the triangle on the circle we can easily see the principal angle it creates and the coordinates of the point on the circle….It’s the lengths of the triangle….and since the hypotenuse is one the lengths correspond to the Cosine and sine value of that angle. The physicality of this I believe helped allow the students to grasp what the circle shows.

Fix

This week in our MEL3E class used Fry’s Bank from Dan Meyer.

This problem, like many 3-Act Math problems, allowed my class to discuss, question assumptions, and uncover math. The problem helped restore some of our great classroom atmosphere that we’ve been missing lately. I want more! This coming week we’ll keep working through compound interest problems. I’m planning on doing Robert’s Not Cashing the Cheque problem.  After that my resources for compound interest problems are pretty thin. I want to continue posing interesting problems to my students. Can you suggest some? Do you have great compound interest problem that keep students curious and questioning? I’m looking for some!! Share those great problems here or on #fave&Fix on Twitter. I’m looking forward to what you come up with.

[Update]

Thank to all of you who commented through Twitter on great compound interest problems. Here is one from Diana,

Here’s where our class went on Monday:
We started off with Robert Kaplinksy’s How Much Did Patrick Peterson Lose By Not Cashing His Check problem. Go ahead and read his lesson plan.

What made this problem great for our class was the discussion that occurred before any math happened. An amazing argument bubbled up with one side saying “Who cares….what’s the big deal” and the other side saying “That’s just super insensitive…..I could use the interest off that account”. My class from the beginning of the year was back! They had put away the drama that had happened between them and focused on the problem. We guessed at the interest he was losing daily. And then using the info from Robert’s site calculated the interest in the first couple of days. Then broke out the Finance Solver to determine how much was lost for the 27 days.

img_2488

The class wanted to know more! They wanted to know what he would lose if he didn’t cash it for the year, 2 years, 5 years!! So we did that too.

img_2487

Next, we investigated Robert’s How Much Should Dr. Evil Demand?


Read Robert’s post to see the plan.

Again, with this group, we didn’t use exponential functions…but the Finance Solver to determine what $1000000 would be worth 3o years later with average inflation of 5.33% per year. We also extended to find how long we would have to wait for $1 million to be worth $100 billion.

Thanks for the help!

More on Compound Interest, Financial Literacy and More

If you are interested in finding more ways to bring out financial literacy concepts in your classroom, consider subscribing to my podcast called Invested Teacher on Apple, Spotify, YouTube and other platforms. While we focus on how we as educators can better manage and invest our money, we also have episodes where we chat about how we can share that financial learning with our students, too.

Pentomino Puzzles

A few years ago I was introduced to a series of activities (through my then districts math consultant) that builds a driving need for students to createscreen-shot-2016-09-30-at-8-14-39-am, simplify, and solve linear equations. I used the activity for a few years in a row while I taught grade 9 academic. Since then I had forgotten all about it (funny how that goes) UNTIL NOW!

The activity ran as a series of challenge puzzles around Pentominoes and a giant hundred grid chart.

Activity 1: Explore

Ask students in groups to choose this tile and place it on the hundreds chart so that it covers a sum of 135. The task seems so simple to start but unpacks some great math.

Allow them to determine this sum anyway they like.

img_2197

I circulate and listen to their strategies. I give them very little feedback at this point. After a few minutes I choose some of those groups I heard interesting strategies to share..then let any other group share out their strategy.

img_2198Activity 2: Keep Exploring

I have them use the same tile and try again. Place the tile so that it covers a sum of 420. Listen to those strategies! Most groups that didn’t have a strategy before will try to adopt a strategy they heard last round. At this point most students will catch the strategy “If I divide the sum by 5, being like the average then I should have the middle number in the shape.”

This is where I stop and have a formal discussion as to why dividing by 5 here works? Will this always work? Will this always work with other shapes? What other shapes will this work with then?

We formalize the strategy.

Our big problem to start is not knowing where to place the tile. Let’s say I label the middle square n. What will the square immediately to the right of n always be? The left? The top? The bottom? Have them check this out by placing the tile repeatedly back on the grid.

Now let’s add all of those expressions up

img_2201

The middle square must be a multiple of 5!!! I have them try this strategy out by throwing out another sum and have them place the tile.

Look at another tile!

img_2202

We go back and outline that we could have chosen a different square to label n. Which results in a new equation and solves for different value…..but results in the same placement of the tile!!

img_2203

We continue by me having them select different tiles, giving them sums, having them create equations and solving them. I love how hands-on this lesson is. Holding the tiles adds some “realness” which I feel drives the need to solve these equations.

However,

this year when I remembered this activity I wasn’t sure I still had the tiles kicking around (I found them later). I immediately made a digital version with Explain Everything.

img_1884

The digital version gives each student their own copy and while working in groups can chat about what strategy worked and what didn’t. Before on the paper version….only one student could hold the tile. Also, when students have to voice their strategy through Explain Everything they have to have careful thought. They think about the words they want to use. We this careful thought they get to make their thinking visible for me!

One new addition to the activity I get to make here is that they can create their own pentomino…..and then their own puzzle to share with their classmates.

img_1887

img_1888

Since then I also created the activity with some help from the team over at Desmos

screen-shot-2016-09-30-at-9-23-24-am

Click to access and rune the teacher.desmos.com activity

I love their new conversation tools….I get to pause the class and discuss when needed!

screen-shot-2016-09-30-at-9-24-52-am

Students can even sketch their new tile and create an expression to match! screen-shot-2016-09-30-at-9-24-03-am


Desmos even added some nice extension questions. Love it! screen-shot-2016-09-30-at-9-24-23-am

screen-shot-2016-09-30-at-9-24-34-am

In the future the next time I explore this lesson I see a blend of hands on tiles with digital support. I think having the best of both worlds here can pack a powerful 1-2-3-4-5 punch!

Pick your favourite!

Download the Explain Everything Pentomino Puzzles .xpl file. 

Access the Desmos Activity