Slope & Clothesline

I’ve loved the idea of using a clothesline in math class. I first read about the strategy from Chris Shore and Andrew Stadel and have been looking for ways to work it into my classroom. Calculating the slope of a line from a graph was coming up in my grade ten 2P course and I thought a clothesline will be a great fit.

We had just finished Fawn’s lesson on steepness with staircases that I found linked from Mary Bourassa’s site. From that lesson my students understood the idea of calculating slope by finding the vertical change and dividing it by the horizontal change, but hadn’t done anything abstract on the coordinate grid.

I wanted my students to:

  • Practice calculating slope of a line using two points on a graph.
  • Practice calculating slope of a line given two points (no graph shown).
  • Compare steepness of lines to other lines using the slope.
  • Connect lines that go downward with negative slopes and lines that go upwards with positive slopes.

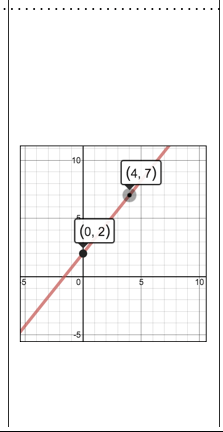
To start our lesson I asked students if they could calculate the slope of this line:

Screen Shot 2016-02-13 at 1.34.56 PM

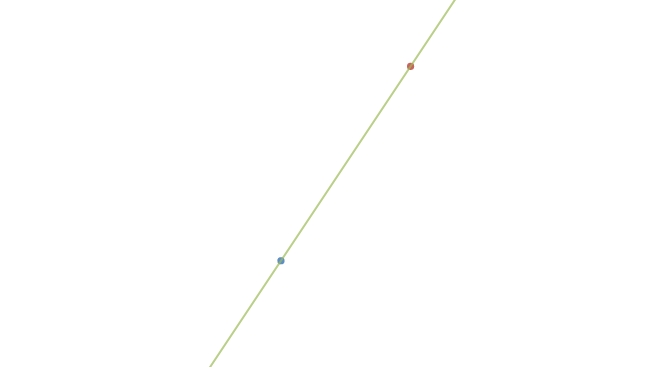
we agreed No. We needed to some measurements! I asked what we could do….a student said “you could give us the grid” Bam! I threw it on there.

Screen Shot 2016-02-13 at 1.47.45 PM

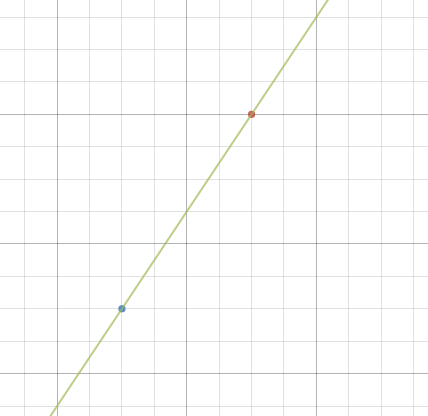
Enough Now? Still no! We needed the x and y axes.

Screen Shot 2016-02-13 at 1.49.19 PM

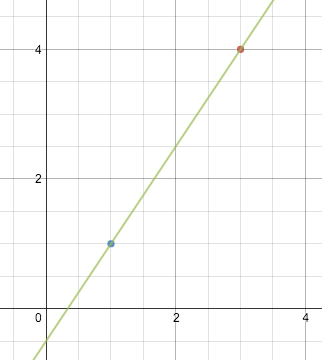
As soon as I dropped the axes on…..I could see them all counting and calculating.

We went through calculating the slope of a line like this…

Screen Shot 2016-02-13 at 1.51.39 PM

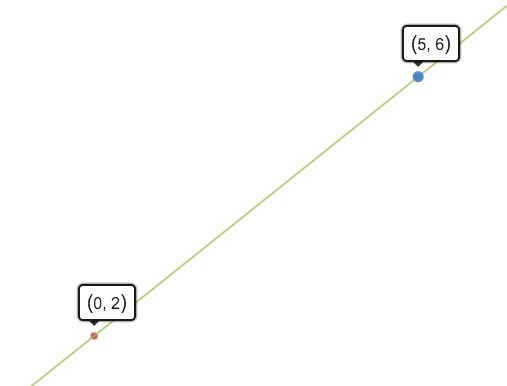
and then finally finding the slope a line passing through…

Screen Shot 2016-02-13 at 1.52.46 PM

It was time to start comparing using a clothesline.

I was originally unsure of how to setup the clothesline for best results as I had never done one. I also wanted to create lines that would give us great results for seeing connections among slope, steepness, and sign value. I enlisted some help from Twitter and recieved some great suggestions


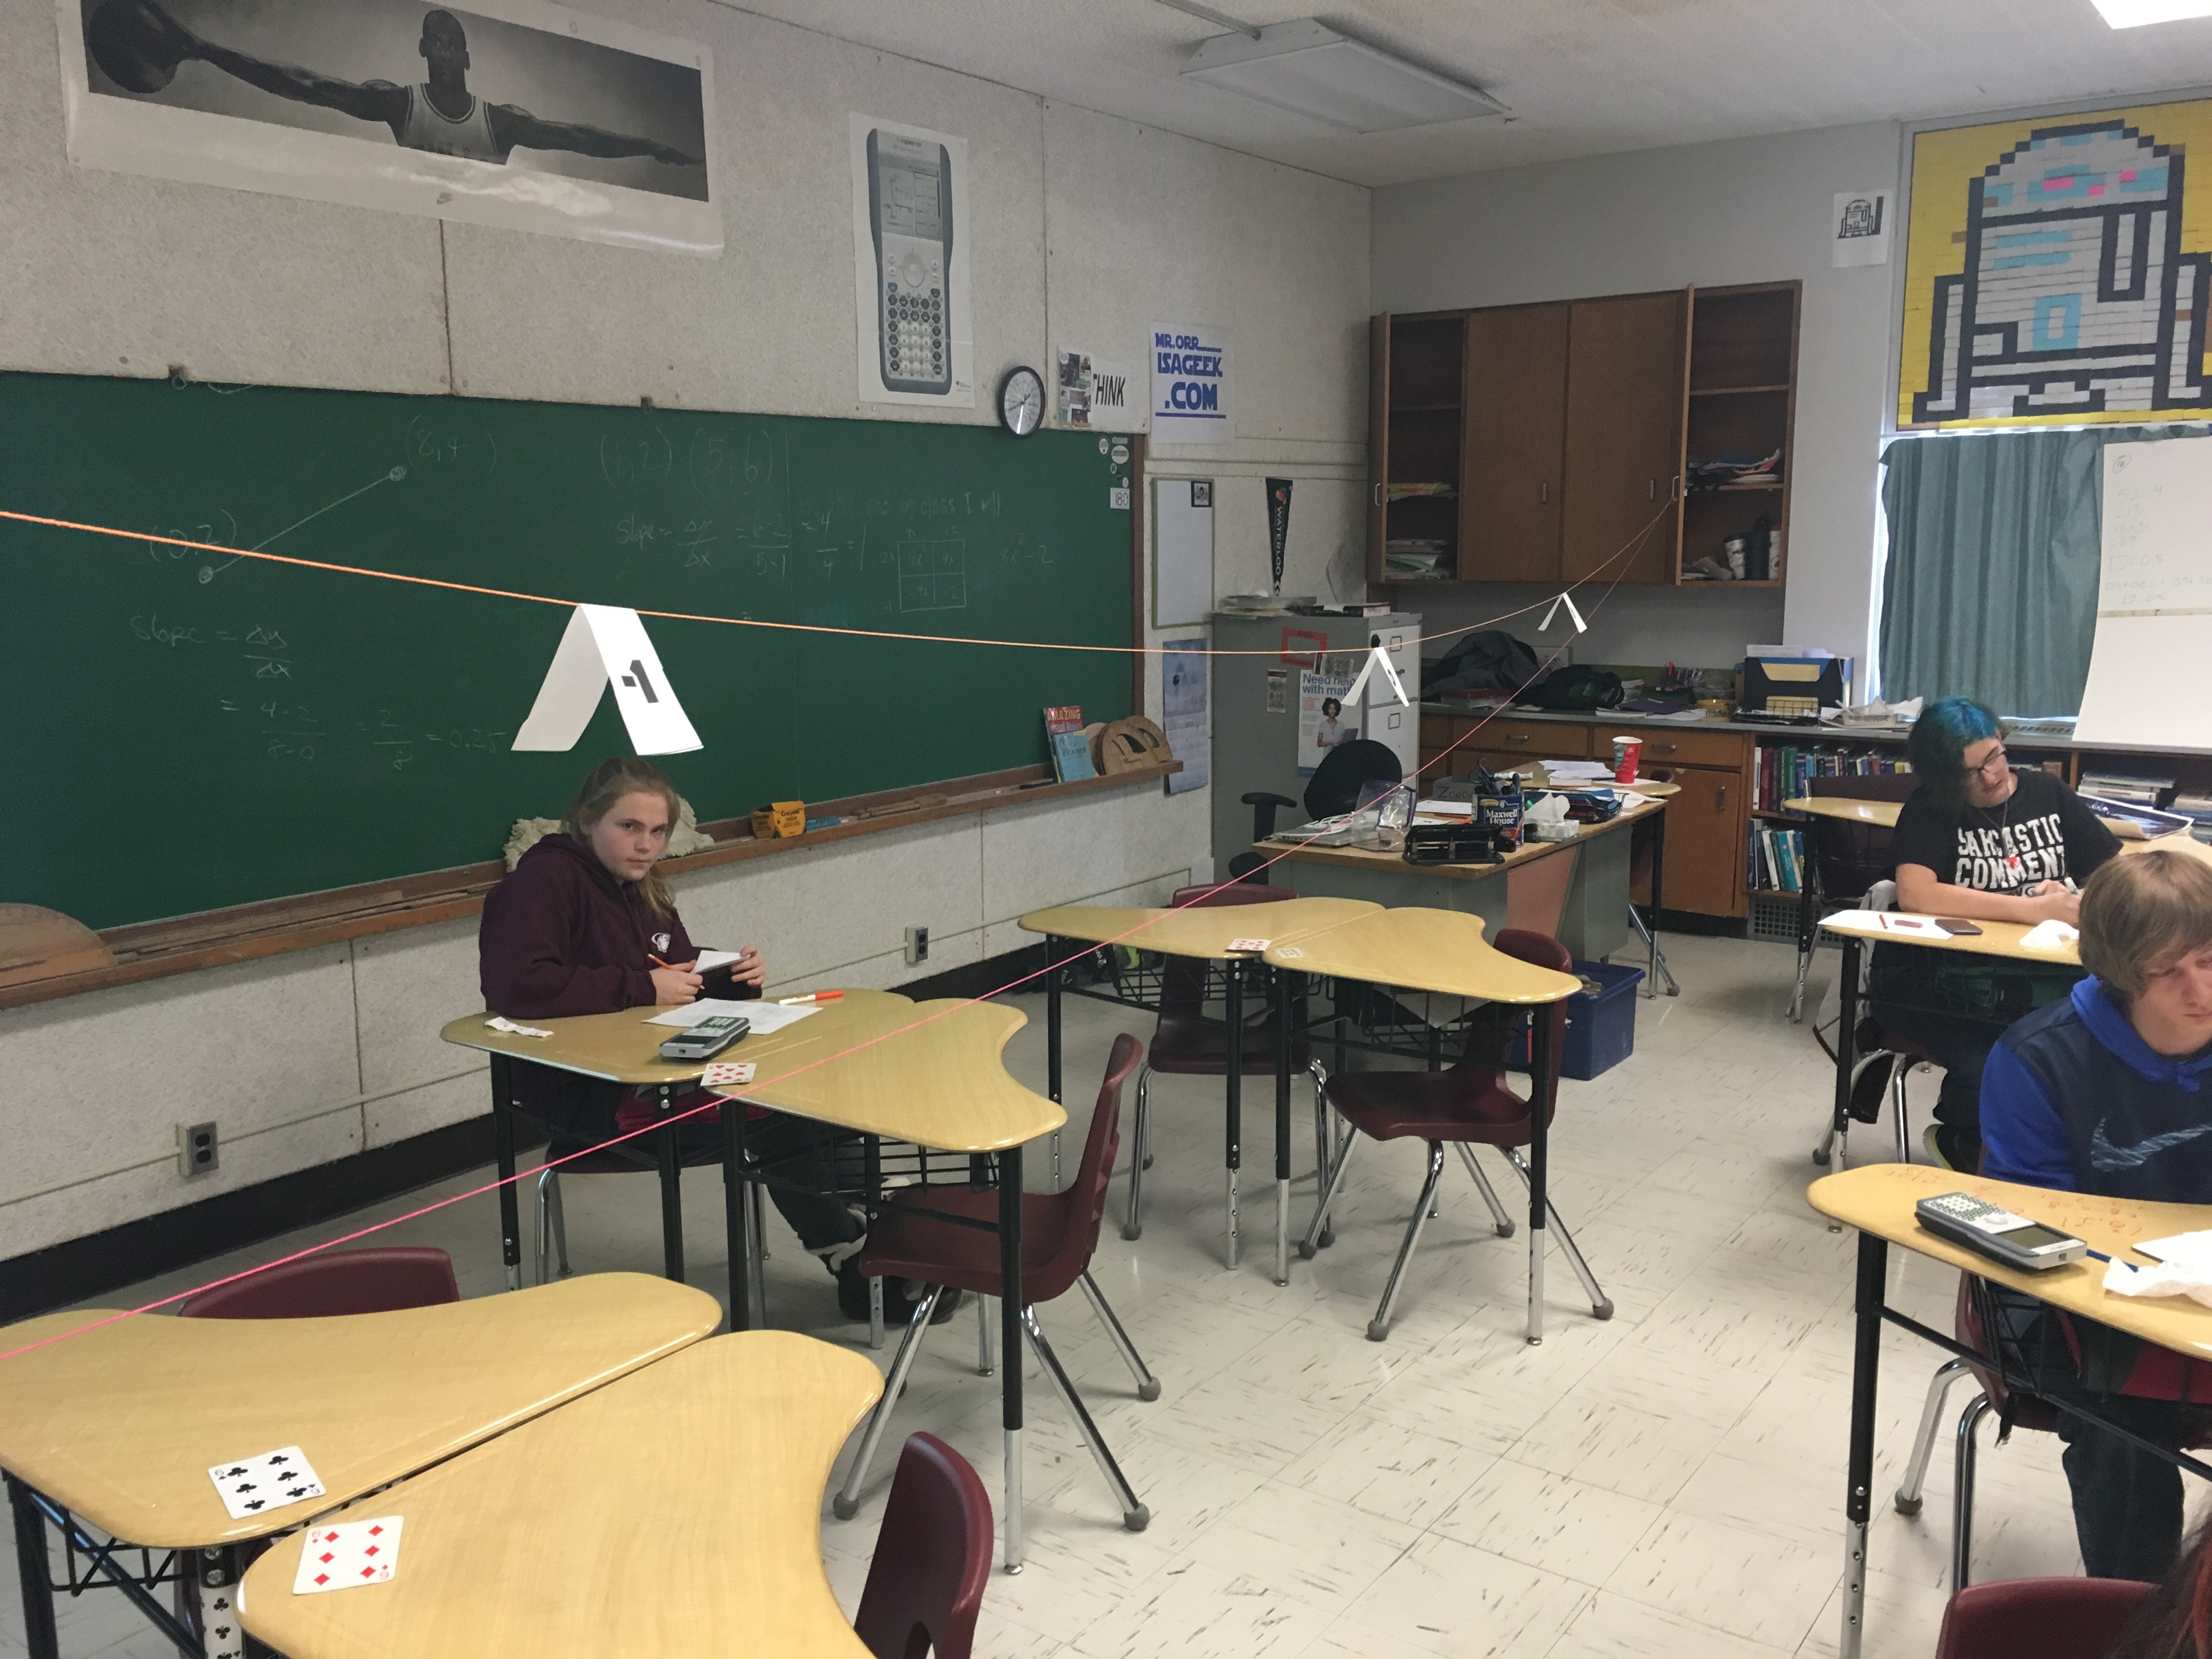
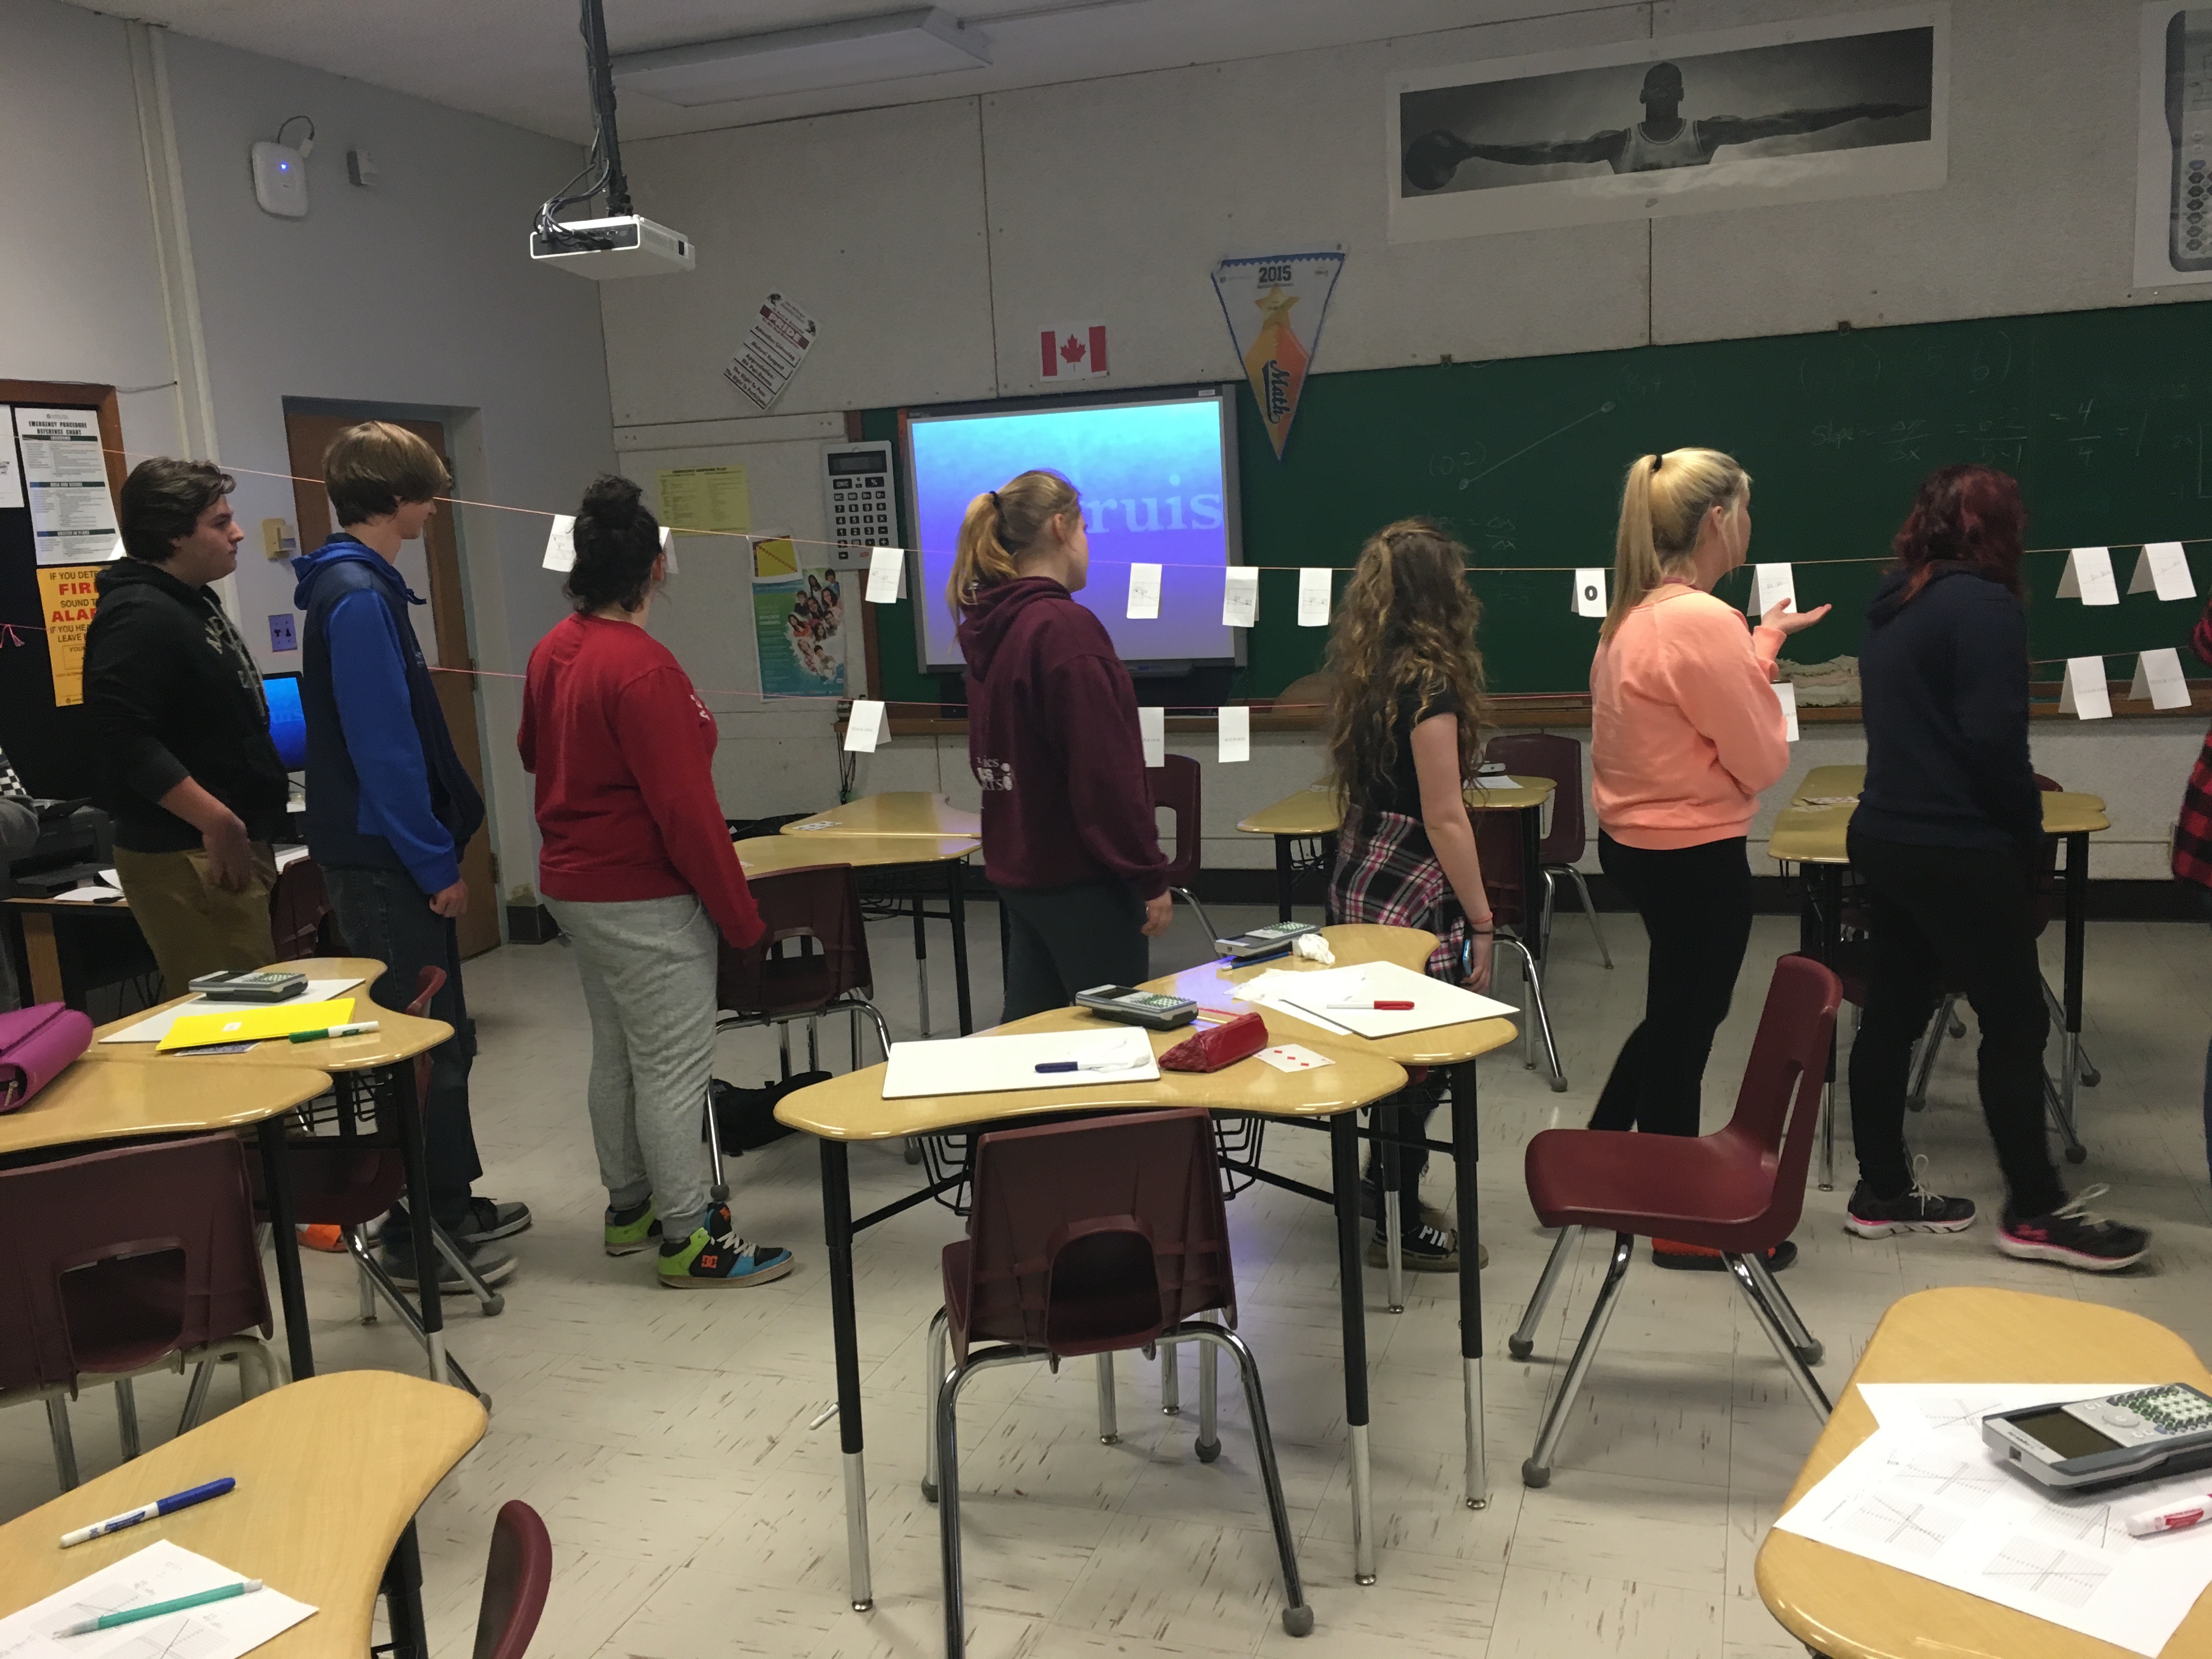
I hung two clotheslines across the room. I placed benchmarks of zero and one on the line. I held up the benchmark of -1 and asked students “where would I place this -1 on the line so it’s right?” They yelled out “more right, more left, LEFT!” until we agreed where it should be.
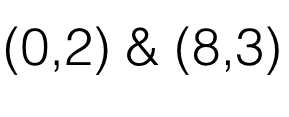
I had whipped up a set of graphs with lines for students to place on the top clothesline and a set of corresponding ordered pairs for students to place on the bottom clothesline.

Cards looked like:

Screen Shot 2016-02-13 at 3.09.16 PM

IMG_0535

I scattered the cards across a table and asked students to choose any card, calculate the slope of the line and then place the card in the right spot on the clothesline.

IMG_0537

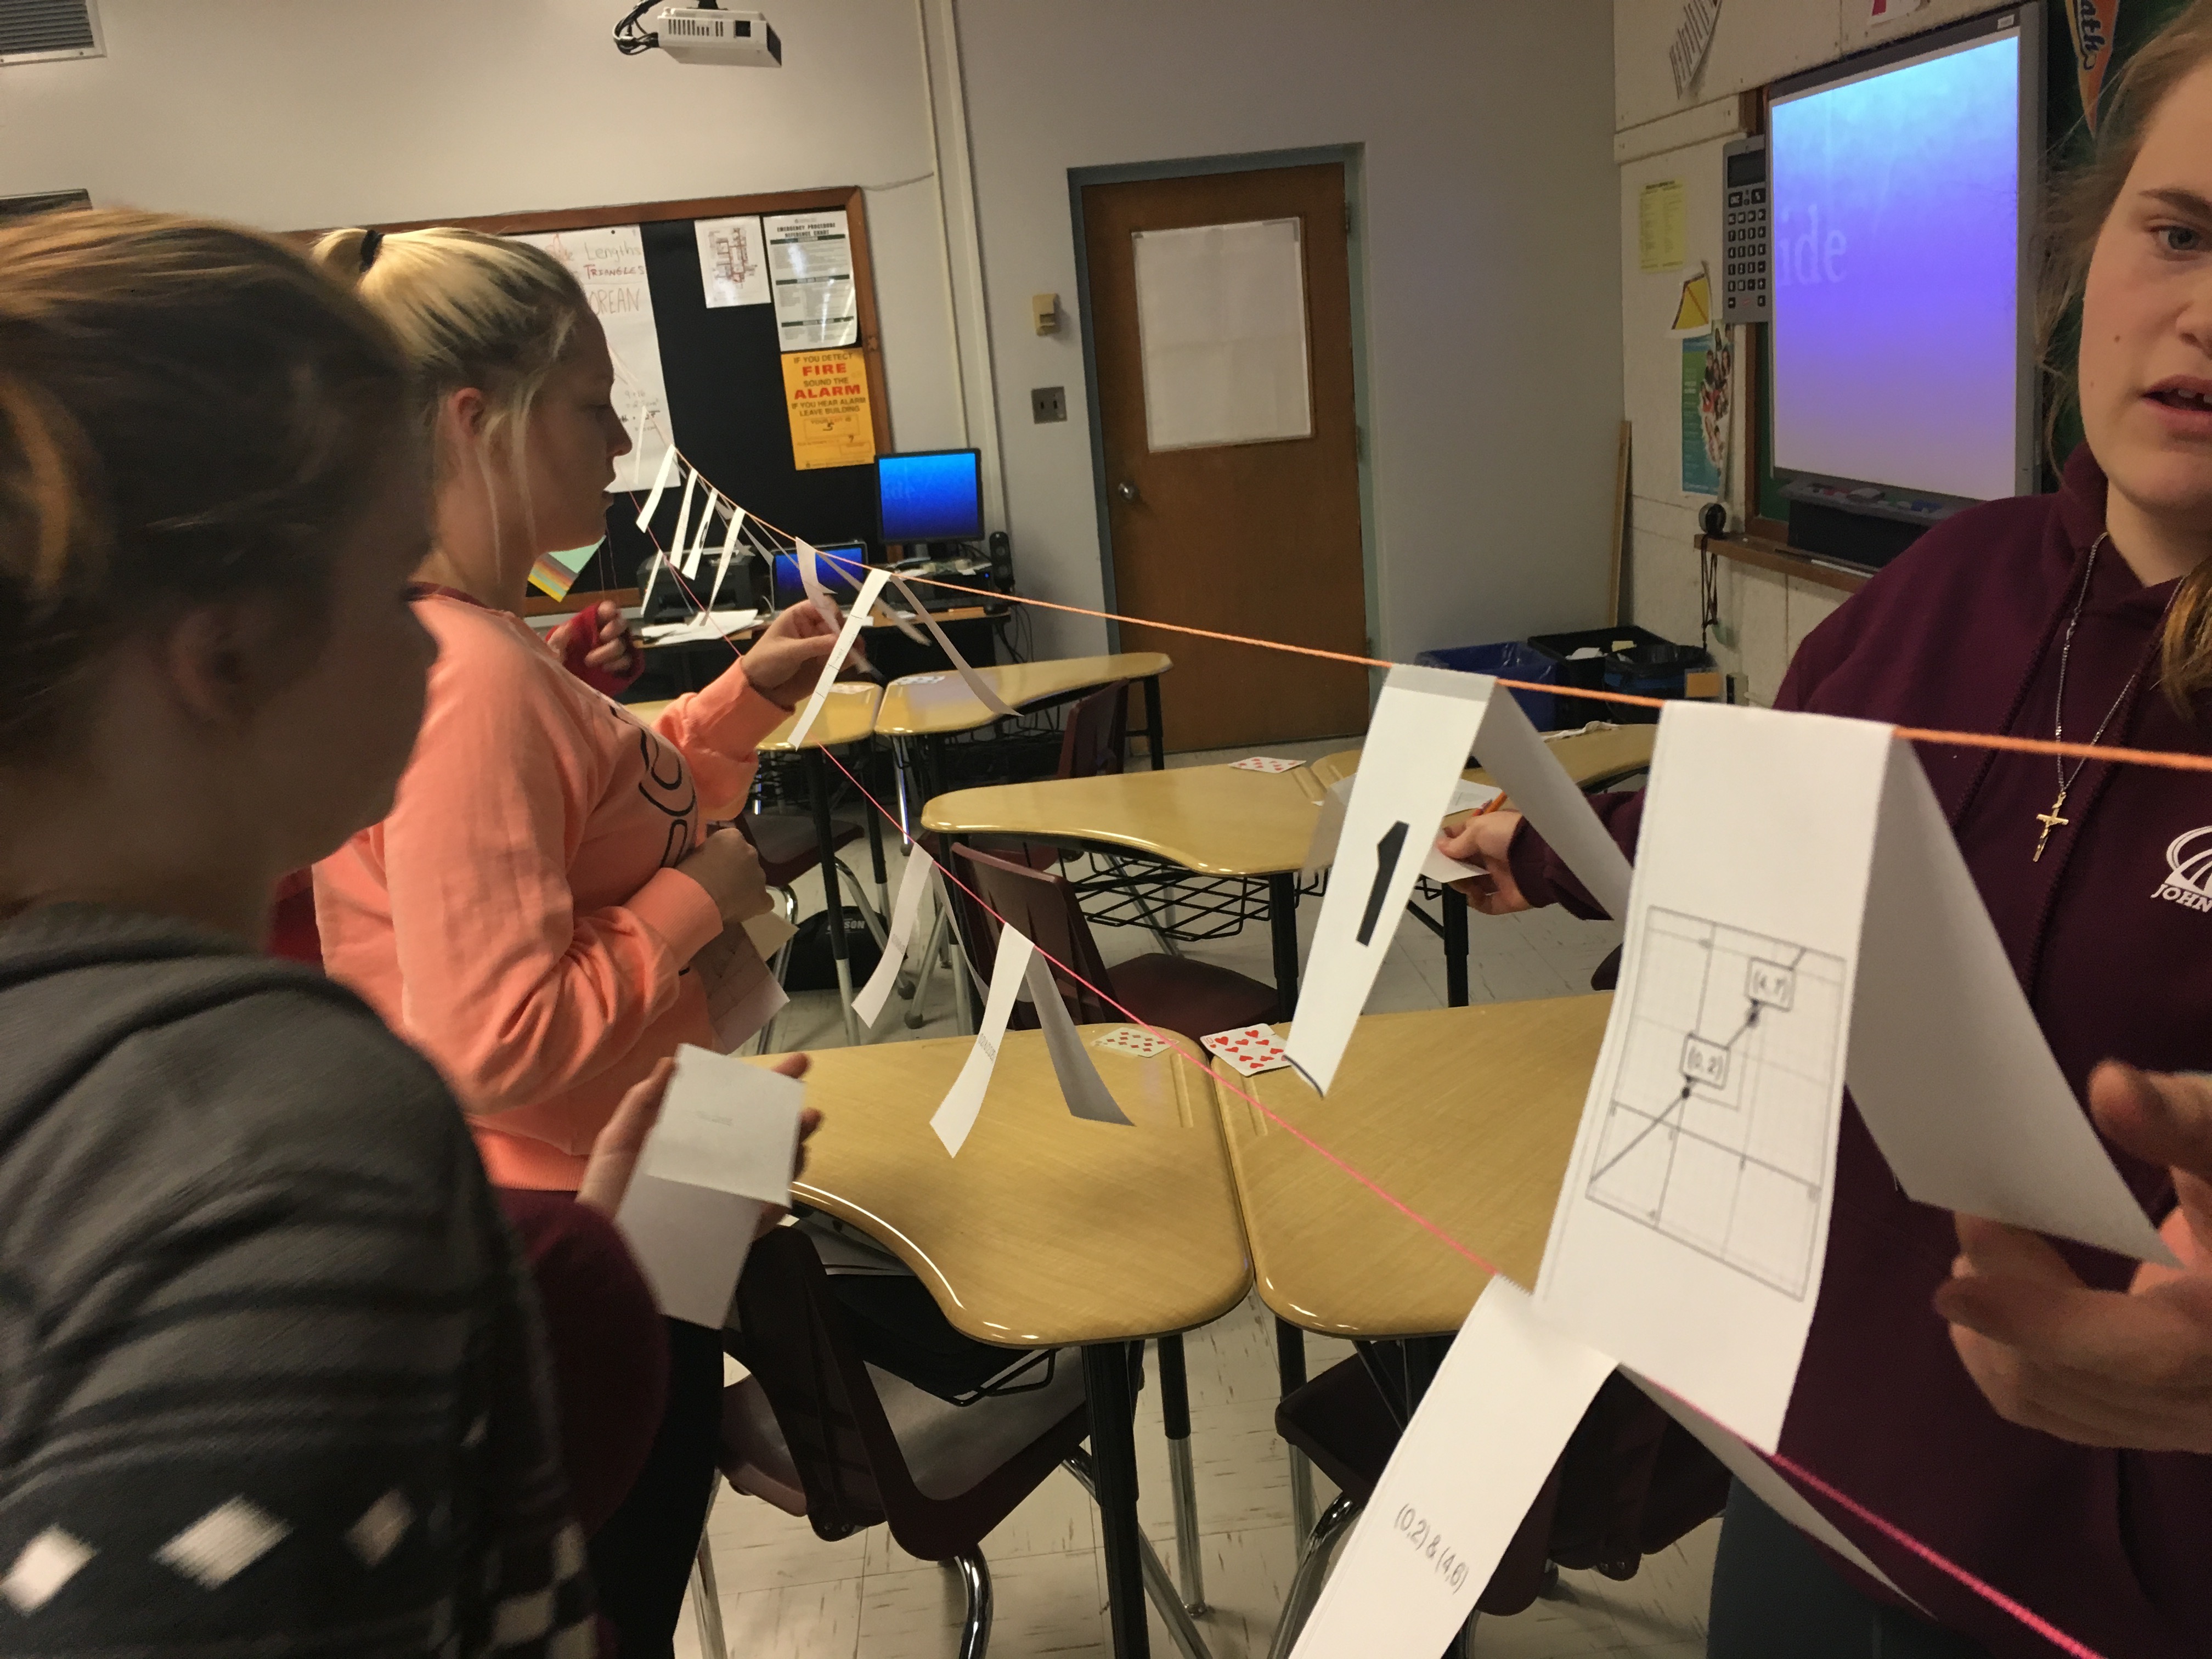
The majority of students calculated the slopes fine but were not confident with their answers…and therefore very hesitant on placing the cards on the clothesline. They wanted me to verify their answers before they placed them. They, however did very well determining where to place the cards.

After all cards were placed I noticed a few errors in placement and asked students to go back to the line and check to see if any seemed out of place. We had some great talks on why we knew some were wrong and I heard “All the negative slopes should be on this side” and “that one seems steeper than that one, so it should be here” Once we had placed all the cards we did a gallery walk. I wanted them to see how the steepness changed as we move from negative to positive.

IMG_0538

This animation shows the gradual change in slope the students would have seen.

We used the patterns to discuss what a line would look like if it had a slope of 0.

There were two lines with a slope of one….I picked them up and we could see talked about parallel lines.

Class finished with us doing two more problems of finding the slope of a line between two points.

I don’t think this lesson was perfect. Could you help me out and provide some suggestions/feedback for me?

Grab the cards:

[aio_button align=”center” animation=”none” color=”blue” size=”medium” icon=”download-alt” text=”Grab the Cards” relationship=”dofollow” url=”https://drive.google.com/open?id=0B3zQp-gapBCeR3pQamJmZDVHdkk”]


Two Trains…

How many of you have seen a problem like this one?

Screen Shot 2016-02-04 at 7.39.04 PM

I’m a fan of taking a problem like this, one that you would assign for homework (in the “application” section of the exercises….and one that very few students even attempt….and someone will ask you to take it up next class) and bring it to the start of my lesson. I’ll teach our concept/idea through this problem. But we can’t just throw this problem up on the board and say “Let’s solve it”……because no will want to. There is no drive for any of us. Like Dan mentions here….who cares!

Who cares about the trains travelling…who cares that they are even trains….they could be bicycles, or cars playing chicken….but is changing the context really going to change how engaging the problem is to students? Dan argues no. I agree.  Before you read about this lesson check out this post on Real vs. Fake world….and the Circle Square lesson on 101qs.com which was an inspiration for changing the Two trains problem around.

Here’s my go at this one:

Show them this video:

ask What do you notice? What do you wonder?

Have students guess WHEN the two dots would meet?

Give some more info

Screen Shot 2016-02-04 at 6.10.53 PM

Have them guess on WHERE the dots will meet?

Have a discussion on what will be needed to determine the times and distances. Spend some time here on speed. Go over the relationship between distance, time, and speed.

Show them this image and have them makes some guesses on where the dots are now.

Screen Shot 2016-02-04 at 8.24.24 PM

then reveal

Screen Shot 2016-02-04 at 6.11.04 PM

Calculate the speeds of the dots. Have students go back to their original guess on time and find how far each dot would travel.  Who in the class is closest? Did anyone guess right?

Now help them generalize…

Create the equations

Screen Shot 2016-02-04 at 9.08.04 PM

If our lesson is on solving this using an algebraic technique we can teach them that here. Or maybe we want to show them the graphical solution. Either way we have taken the tougher question from homework that no one cares about and used it to set up and teach a skill.

Screen Shot 2016-02-04 at 6.23.10 PM

and finally,

I’m sharing this lesson now (before I teach it) with you hoping to get some feedback. Writing these lessons here also help me work out the details. This is week 4 of the #MTBos blogging initiative and its focus is lessons. I won’t get a chance to teach a lesson this week. Our school had final exams and then PD days in preparation for second semester. Good luck to all those starting up again!!


Catch the Spiral! 

Last May I shared my day-to-day planning spreadsheet for my grade 9 applied course. On that sheet I recorded the topic, tasks, and resources for each day of the semester. I used that as a resource for myself when teaching 1P through a spiral this semester. I found that having that sheet to go back too was super helpful and a time saver. This semester I followed that timeline except with a few tweaks here and there.

Since that sheet was so handy to have I made one similar for my MPM2D class. It was my first time spiralling that course and I wouldn’t go back to teaching through units again.

Screen Shot 2016-02-02 at 10.24.12 AM

I heavily relied on Mary Bourassa’s blog….she is amazing. She shares her day-to-day plan as posts on her blog and also shares all of her resources and handouts. Thanks so much Mary!!!

Spiralling in Academic vs. Spiralling in Applied

I struggled initially with deciding to spiral the MPM2D course because of my experience with MFM1P. I had previously taught the 1P course through activities and 3 act math problems so it was a no brainer to just mix up the order of the problems and tasks. It was an easy transition since I had all the resources. For the 2D course though, it had been a while and I had not taught it with a task/activity approach.

What I found to work best in the academic class was to learn all new ideas/topics through activities and productive struggle with some direct instruction thrown in as a consolidation. Unlike the 1P course where I switched tasks/topics daily, I stuck to a topic/idea for a few days or a week in the 2D course. Once, for example, the class was comfortable with transformations of quadratics we would switch to trigonometry for a week, then analytic geometry for a week, etc.

I felt that through spiralling and teaching through productive struggle my students were better problem solvers. They were not just waiting to be told how to solve a problem. They were always actively thinking about which ideas they had learned could apply to solve a particular problem. That confidence I saw allowed us to go more deeply into the content than ever before. We just didn’t skim the surface of the processes, algorithms, and algebra needed, we solved problems!!

If you wanted to spiral the 2D course or a similar course I thought I would share out my plan to help out. Here is my day-to-day plan with links, resources, Desmos activities, 3 Act tasks, assignments, homework, etc from my spiralled MPM2D course. (It’s not fully complete for every day but you’ll get a sense of how the class ran).

[aio_button align=”center” animation=”none” color=”blue” size=”medium” icon=”star” text=”See the plan” relationship=”dofollow” url=”https://docs.google.com/spreadsheets/d/1O6xynI57e9iza6YTP9nEIu6DnbaEeL-KztV5js9xkwg/pubhtml?gid=0&single=true”]

Most files are either Smart Notebook, Apple’s Keynote, or PDF.

Get Apple’s Keynote on your Mac or on iOS.


Sum It Up! 

Here is a small strategy I used for our review day today.

In Advanced Functions we were reviewing average rates of change and instantaneous rates of change.

Instead of just doing problems from the book I organized the rate problems in 4 sets, polynomial, rational, trigonometric, and exponential/logarithmic functions. Each set had 3 problems.

I organized the class in groups of 3 and gave each group a set. They were to complete the problems and check the answers.

The kicker here was that the sum of the 3 answers in a set was written on the board.

img_0464

If the group got all questions correct their sum of their answers would match correctly. But…… If one was wrong they had to check all solutions and decide which needed fixing.

First, this small change made all groups work more carefully than usual. And second, when they had to double back, you could see them rationalizing which answers “had” to be correct and which answers were “toss ups”.

It was a great tool for students to self assess and evaluate their own readiness.

double desks

After each group completed a set they would swap with another group… Eventually completing all sets.