Sneaking in Factoring

I started a series of new warm ups for my MPM2D class today. My goal is to sneak in factoring as warmups throughout the semester. By the time we need to learn it (like when we need to factor to solve equations) we will have mastered it already. I also previously snuck in multiplying binomials when we tackled quadratic patterns as Mary Bourassa did in her 2D class.

So today I gave them this slide and said I want you to solve a puzzle!

Screen Shot 2015-09-29 at 9.04.00 PM

They broke out their iPads and used the Algebra Tile app to put together the rectangle. The kids worked away and you could see them trying to put tiles in a way to make the rectangle

….and they soon found out that they had to fit a certain way!! 
On take up we made sure everyone had either my rectangle or a rotated version.

Then we did this one…..

Screen Shot 2015-09-29 at 9.04.25 PM


After we were done I asked the class: “If the combination of squares and rectangles makes up the area, what are the dimensions of the rectangle?” They had a little bit of a hard time here, but finally could see the x + 4 and the x + 2 as the length and the width. I then wrote …

 And then I heard some “aaah”s. We had previously seen both versions of the quadratic expressions and discussed why the factored form helped us out quite a bit if we wanted to find the x-intercepts.

We stopped there….It only took us 15 minutes. Tomorrow we will do a few more…..always writing the factored form after. I will also try to get students to notice efficient strategies to make the rectangles.

  • Why did you put 4 x terms along the width and 2 x terms along the length?
  • How does that relate to the number of singles?

Where I hope to go with these warm ups is to factor all types of trinomials:

  • Perfect Squares

    daum_equation_1443575324234

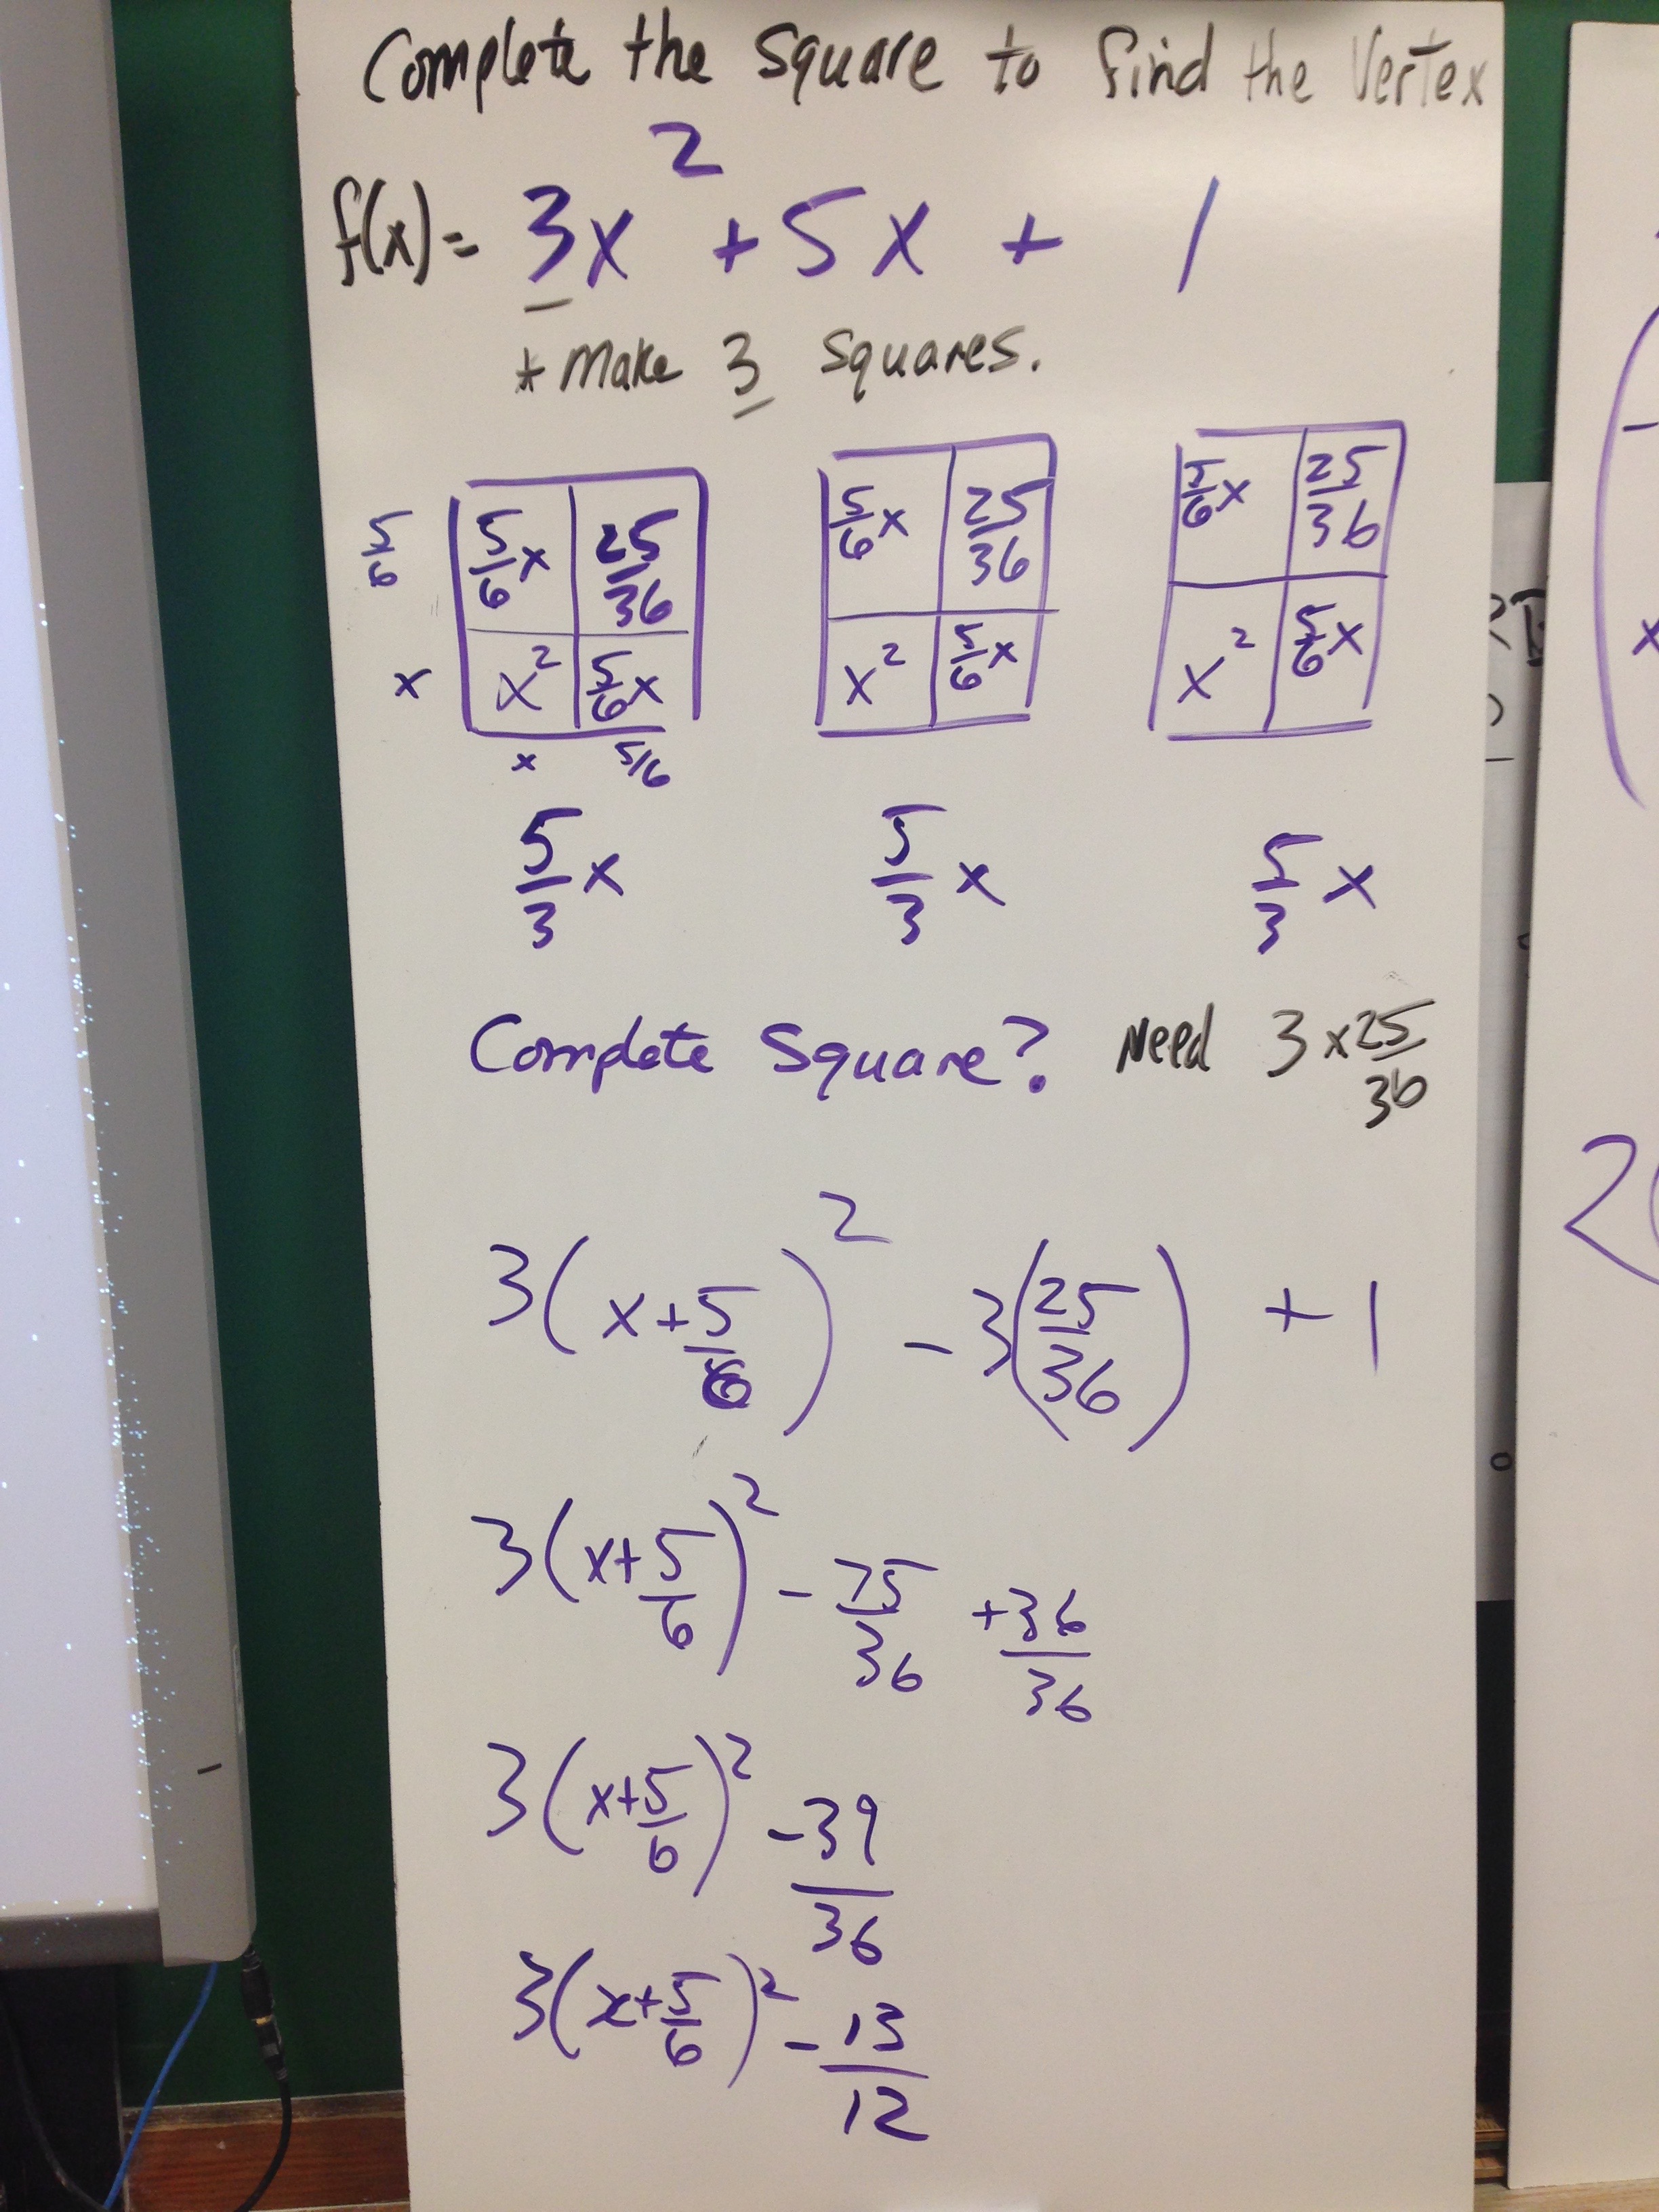
    This time…..make a square

… and get this…

IMG_1503

  • Trinomials of the Type ax^2 +bx + c


IMG_1504

  • Completing the square too!!!!
IMG_1508

This time…make a square


IMG_1506
We’ll be definitely working our way out of the app and onto paper with area diagrams…

IMG_2988

Factoring


IMG_2990

Completing the square

IMG_2991

Completing the square

I think working with these puzzles for the next few weeks first will give us a strong base when it’s time to factor to help solve equations and then complete the square. I think I’ll track all the warm ups we do like this and I’ll post them all!

Lesson Study & Big Ideas

For the last few years my school has been apart of the SSI (School Support Initiative). In small teacher groups we discussed learning gaps we see in our students and then implemented teaching strategies to shorten those gaps.

Last year we identified perseverance as a learning gap. We felt that our grade  9 and 10 applied level students gave up too easily. If an answer didn’t come to them right away they “packed it in” and didn’t really try. We also felt that, especially in math this “packing it in” was due to lack of confidence in their ability. We spent the year focussing on giving great feedback and using growth mindset language. We spent our release time money on mostly bringing in supply teachers while we conferences with students. We talked about where they were and gave them specific feedback to help them get better. We always talked in terms of constant improvement.

This year we are a cross curricular group: 3 math teachers, 1 science and 1 geography. We had a great brainstorming session on learning gaps. Although I still think confidence in math is a huge deterrent in producing quality work we decided our learning gap would be

“Student understanding of main ideas and the big picture”

Our group felt that students sometimes were missing the main idea during and after a lesson. Students might be able to get by memorizing what we were doing in class but missed the big idea.

In my class I wanted to see if this was a problem…. So we set out to get a pre-assessment. We needed to see who in our classes was getting the big idea and who wasn’t. I decided to use Andrew Stadel’s Filing Cabinet problem and not tell them in advance we were learning about surface area. I wanted to see if they could see past the filing cabinet and see that we are solving problems with surface area.

Act 1: The video

If you’re not familiar with this problem read about here or grab the full lesson on 101qs.com

Have a look at this solution….there is a 936 post it note answer in there somewhere!

IMG_8293

After we solved the problem I presented them with this slide

Screen Shot 2015-09-28 at 7.29.15 PM

Here are some of their responses.

Screen Shot 2015-09-28 at 8.07.15 PM Screen Shot 2015-09-28 at 8.08.27 PM Screen Shot 2015-09-28 at 8.12.00 PM Screen Shot 2015-09-28 at 8.10.43 PM Screen Shot 2015-09-28 at 8.09.44 PM Screen Shot 2015-09-28 at 8.13.15 PM Screen Shot 2015-09-28 at 8.03.53 PM Screen Shot 2015-09-28 at 8.06.25 PM

Our next step is Lesson Study! Every time we meet we will plan together an upcoming lesson for one teacher. Then we will all go and watch to see the student reactions and thinking during this lesson. This will be my first time going through this process and I’m pretty excited to plan a lesson with 4 other teachers. I am interested to go through this process to improve my teaching and improve student learning around the big ideas!

Distance Formula without the Formula

Today in MPM2D our main goal was to discover how to find the distance between two points. But since I’m spiralling the 2D course I wanted to think big picture…I  wanted to tackle this overall expectation: verify geometric properties of triangles using analytic geometry.

We started with this beauty from Would You Rather  — www.wyrmath.wordpress.com

Students argued and discussed which ramp they would rather push that crate up. Most of the class picked A with their reason being it’s less steep and less work. One of the students who picked B said “I want muscles…..so I’m going to push that crate up the steepest slope“. Another student picked B because they wanted less distance and wanted to “get it over with“.

I left the discussion hanging here knowing I was going to come back and revisit this with more ammunition.

I showed them this video

and we completed the Corner to Corner problem (see the lesson plan here) to remind ourselves of the Pythagorean Theorem.

We came back to the Would You Rather problem from above and practiced finding the length of each hypotenuse to see how long each was.

I then presented them with this……and said our goal was to find the length of this line segment.

Screen Shot 2015-09-28 at 2.21.14 PM

Find the length of this line segment

I asked…”If I could help you out or provide you with more info what would you want?” Most students said they would want either a ruler or some sort of dimensions or units to look at.

So I  brought up the grid on Desmos and asked if this was enough.

Screen Shot 2015-09-28 at 2.21.38 PM

Most students thought it was…..I could see them drawing right triangles on their whiteboards and filling in the lengths of the legs. But one students yelled out “What is the scale?” ….Everyone paused! ….. I brought up the axis!

Screen Shot 2015-09-28 at 2.21.56 PM

Students finished drawing their right triangles and said that was easy! We did one more just like this (giving them the grid and axis) to practice.

FullSizeRender-3

Here’s the next challenge: I took away the grid but gave them the coordinates of the endpoints. Find the length of this line segment.

Screen Shot 2015-09-28 at 2.22.47 PM

I let them struggle a bit here. The majority of the class prevailed and had a similar solution on take up:

FullSizeRender-1

Student words: “One leg was the difference between the x-values and the other leg was the difference between the y-values”

We did another in the same format to practice this discovery.

Screen Shot 2015-09-28 at 2.23.08 PM

Then I took it up a notch…

Screen Shot 2015-09-28 at 2.23.30 PM

The three points shown represent vertices of a triangle. Classify the type of triangle.

And I saw a lot of this…


FullSizeRender

I’ve been following Mary Bourassa’s Blog and I stole creating my own homework sets from her….so I left the class to complete this. Love how I can ask lagging questions in my homework. Students get multiple opportunities to master skills.

So we’ll take up those questions tomorrow and we’ll summarize the strategy to find the length of a line segment using this formula…daum_equation_1443477587316

Access: Pre-made Desmos graphs


Lollipop Lollipop oh la la Lollipop! — & Rates of Change

Last year on twitter I saw that Alex Overwijk and Janice Bernstein with their grade 12 advanced functions classes did this lollipop activity!

I knew that I wanted to give this a try for this semester! What I especially love about this activity other than students experiencing rates of change is that this is an activity that can span multi-grades!

Here is what we did,

Generating Curiosity

I found this video on YouTube and asked the class to think of great questions we could ask about what we see!

FullSizeRender-1Great questions from the kids and we all agreed to look at

  • How does the sucking time affect the radius, circumference, volume, and surface area?
  • How long will it take until the lollipop is all gone?

Let’s investigate those relationships starting with the easy to measure (circumference) and also estimate how long it will take until the lollipop is no more!

We had guesses : ranging from 10 minutes through to 35 minutes.

Gathering Data

I handed out one lollipop per pair of students, along with some dental floss for measuring circumference. We set our timer for 30 seconds and began sucking and capturing data!
We recorded the circumference every 30 seconds up to 7 minutes like Al’s and Janice’s instruct in their lesson Plan.
FullSizeRender
They also have a great handout for tracking the circumference over the 30 second intervals. Screen Shot 2015-09-18 at 2.22.08 PM

Analyzing the Data

So we first looked at the Time vs. Circumference and Time vs. Radius relationship
Linear - Lollipop

Screen Shot 2015-09-18 at 2.27.24 PM
We discussed its linearity and why. Students predicted with more accuracy when their lollipop would run out.
Up to this point this task is great for grades 7, 8, 9, or 10!! (Just edit the file to exclude the average and instantaneous rates of change).

  • Grade 7 & 8: Practice plotting points and reading/interpreting graphs.
  • Grade 9 & 10: Find lines of best fit and first differences.

We found the average rate of change for each 30 second interval and discussed what this meant. We used the last column to talk about narrowing the interval down to estimate the instantaneous rate of change, and noticed that it’s about the same for all values. Why does this make sense???

7Yar2VXD


We moved on to looking at Time vs. Volume and Time vs. Surface Area

Screen Shot 2015-09-20 at 9.33.23 AM

Great talks around how Volume and Surface aren’t deceasing at a constant rate! It changes! Students can see these changes and see in their tables where the volume is changing the fastest.

Overall a great intro activity to get students thinking about narrowing intervals to approximate instantaneous rates of change.

Next up: We’ll relate what we did here with the tables to the graphical interpretation of rates of change (secant and tangent lines) and then on to the algebraic!

Screen Shot 2015-09-20 at 6.23.18 PM