Distance Formula without the Formula

Today in MPM2D our main goal was to discover how to find the distance between two points. But since I’m spiralling the 2D course I wanted to think big picture…I  wanted to tackle this overall expectation: verify geometric properties of triangles using analytic geometry.

We started with this beauty from Would You Rather  — www.wyrmath.wordpress.com

Students argued and discussed which ramp they would rather push that crate up. Most of the class picked A with their reason being it’s less steep and less work. One of the students who picked B said “I want muscles…..so I’m going to push that crate up the steepest slope“. Another student picked B because they wanted less distance and wanted to “get it over with“.

I left the discussion hanging here knowing I was going to come back and revisit this with more ammunition.

I showed them this video

and we completed the Corner to Corner problem (see the lesson plan here) to remind ourselves of the Pythagorean Theorem.

We came back to the Would You Rather problem from above and practiced finding the length of each hypotenuse to see how long each was.

I then presented them with this……and said our goal was to find the length of this line segment.

Screen Shot 2015-09-28 at 2.21.14 PM

Find the length of this line segment

I asked…”If I could help you out or provide you with more info what would you want?” Most students said they would want either a ruler or some sort of dimensions or units to look at.

So I  brought up the grid on Desmos and asked if this was enough.

Screen Shot 2015-09-28 at 2.21.38 PM

Most students thought it was…..I could see them drawing right triangles on their whiteboards and filling in the lengths of the legs. But one students yelled out “What is the scale?” ….Everyone paused! ….. I brought up the axis!

Screen Shot 2015-09-28 at 2.21.56 PM

Students finished drawing their right triangles and said that was easy! We did one more just like this (giving them the grid and axis) to practice.

FullSizeRender-3

Here’s the next challenge: I took away the grid but gave them the coordinates of the endpoints. Find the length of this line segment.

Screen Shot 2015-09-28 at 2.22.47 PM

I let them struggle a bit here. The majority of the class prevailed and had a similar solution on take up:

FullSizeRender-1

Student words: “One leg was the difference between the x-values and the other leg was the difference between the y-values”

We did another in the same format to practice this discovery.

Screen Shot 2015-09-28 at 2.23.08 PM

Then I took it up a notch…

Screen Shot 2015-09-28 at 2.23.30 PM

The three points shown represent vertices of a triangle. Classify the type of triangle.

And I saw a lot of this…


FullSizeRender

I’ve been following Mary Bourassa’s Blog and I stole creating my own homework sets from her….so I left the class to complete this. Love how I can ask lagging questions in my homework. Students get multiple opportunities to master skills.

So we’ll take up those questions tomorrow and we’ll summarize the strategy to find the length of a line segment using this formula…daum_equation_1443477587316

Access: Pre-made Desmos graphs


Lollipop Lollipop oh la la Lollipop! — & Rates of Change

Last year on twitter I saw that Alex Overwijk and Janice Bernstein with their grade 12 advanced functions classes did this lollipop activity!

I knew that I wanted to give this a try for this semester! What I especially love about this activity other than students experiencing rates of change is that this is an activity that can span multi-grades!

Here is what we did,

Generating Curiosity

I found this video on YouTube and asked the class to think of great questions we could ask about what we see!

FullSizeRender-1Great questions from the kids and we all agreed to look at

  • How does the sucking time affect the radius, circumference, volume, and surface area?
  • How long will it take until the lollipop is all gone?

Let’s investigate those relationships starting with the easy to measure (circumference) and also estimate how long it will take until the lollipop is no more!

We had guesses : ranging from 10 minutes through to 35 minutes.

Gathering Data

I handed out one lollipop per pair of students, along with some dental floss for measuring circumference. We set our timer for 30 seconds and began sucking and capturing data!
We recorded the circumference every 30 seconds up to 7 minutes like Al’s and Janice’s instruct in their lesson Plan.
FullSizeRender
They also have a great handout for tracking the circumference over the 30 second intervals. Screen Shot 2015-09-18 at 2.22.08 PM

Analyzing the Data

So we first looked at the Time vs. Circumference and Time vs. Radius relationship
Linear - Lollipop

Screen Shot 2015-09-18 at 2.27.24 PM
We discussed its linearity and why. Students predicted with more accuracy when their lollipop would run out.
Up to this point this task is great for grades 7, 8, 9, or 10!! (Just edit the file to exclude the average and instantaneous rates of change).

  • Grade 7 & 8: Practice plotting points and reading/interpreting graphs.
  • Grade 9 & 10: Find lines of best fit and first differences.

We found the average rate of change for each 30 second interval and discussed what this meant. We used the last column to talk about narrowing the interval down to estimate the instantaneous rate of change, and noticed that it’s about the same for all values. Why does this make sense???

7Yar2VXD


We moved on to looking at Time vs. Volume and Time vs. Surface Area

Screen Shot 2015-09-20 at 9.33.23 AM

Great talks around how Volume and Surface aren’t deceasing at a constant rate! It changes! Students can see these changes and see in their tables where the volume is changing the fastest.

Overall a great intro activity to get students thinking about narrowing intervals to approximate instantaneous rates of change.

Next up: We’ll relate what we did here with the tables to the graphical interpretation of rates of change (secant and tangent lines) and then on to the algebraic!

Screen Shot 2015-09-20 at 6.23.18 PM


Speedy Squares

Last week I attended the annual OAME (Ontario Association of Mathematics Educators) in Toronto. It was so great to finally meet some of the people I’ve been tweeting with.

I was pumped to attend Mary Bourassa’s double session on great classroom activities. One of the activities that I’ve seen on her blog, but not used in my own classroom was Speedy Squares. So when I had an opportunity to try it, I jumped on it!

There is something special about doing the lessons yourself while learning about a lesson at a conference.

Read about the lesson:

You can read about the lesson on her blog here part 1 and here part 2.

[aio_button align=”center” animation=”none” color=”blue” size=”small” icon=”download-alt” text=”Download Now” relationship=”dofollow” url=”https://www.dropbox.com/s/4alwa51yhra2wgy/Speedy%20Squares.docx?dl=0″]

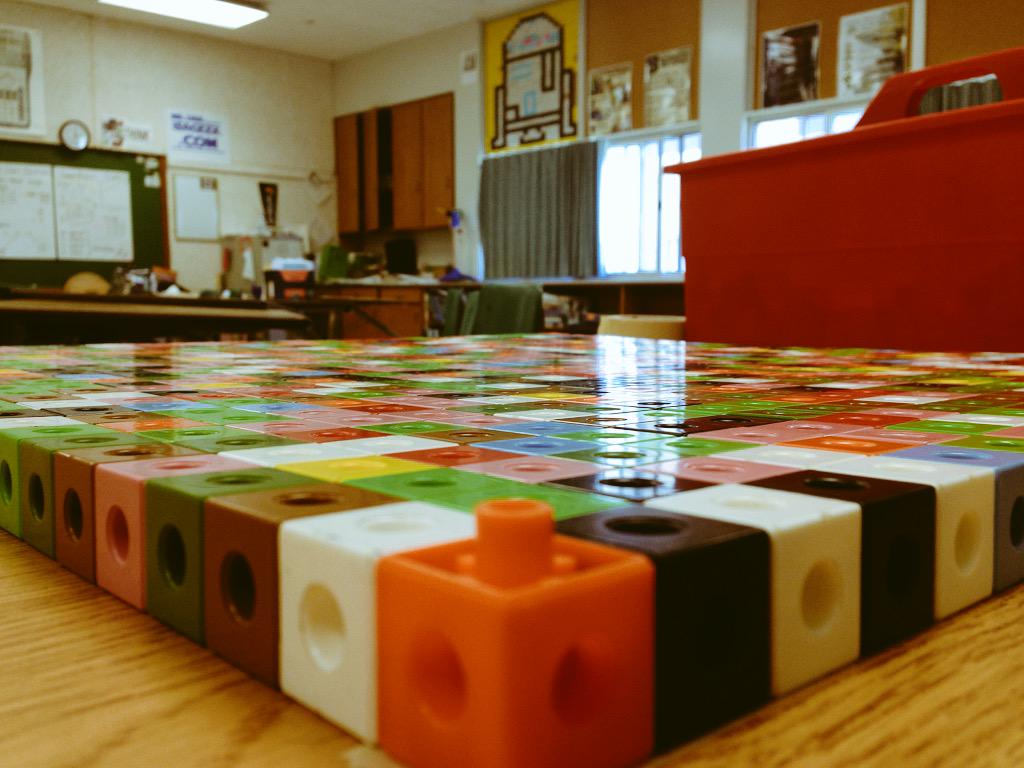
The big question: We want to determine how long it will take to build a 26 x 26 square out of link cubes.

More Curious

While actively building the squares I had a great idea to make the introduction to the activity a little more curious! So when I got back to my classroom I broke out the cubes and created this….

Maybe before the time trials of building the squares, we can dive into generating questions and wonderings first.

  • What is he making?
  • How many squares will he use?
  • How long will it take?

Now that we have generated questions….we can then move onto Mary’s awesome two day lesson.

Once students have got an answer to how long they would take to build the 26 x 26 square, you could show the video of me building it!

I’m really interested to see if elementary teachers can use this in their classes and what they come up with!

Sorting Out Explain Everything

There are lots of great things in Math being done with the app Explain Everything! Explain Everything has been the go-to app of choice for many teachers, students to showcase learning and understanding.
Students in my class have used this app to explain major concepts from the course. For example, a student used the app to create a video on the differences between Direct and Partial variation.

The app can be used for other great uses besides video recording…

I have been using the app to create short Sorting activities.

20131201-105523.jpg

 Click the picture and download the Explain Everything .xpl file.


The white space in the app allows users to easily move, rotate, and sort images on the screen. In the example above, as a warm up my students were asked to sort the solution to the equation in the correct order. We then had discussions on steps to solve equations.

Below is another sorting activity on sorting out linear relations. They were asked to match up tables, graphs, equations, and descriptions.

20131201-105614.jpg

 Click the picture and download the Explain Everything .xpl file.


Another sorting activity: For MPM2D or MCF3M or MCR3U – Sorting the Quadratic Formula. Students were asked to sort out solutions to solving equations by completing the square. After sorting a number of solutions, they were asked to sort the general development of the Quadratic Formula.

20131201-105645.jpg

 Click the picture and download the Explain Everything .xpl file


With Explain Everything’ ease to make how to videos, and sorting activities…..it’s a must have on your iPads.